The Opening Range Breakout is one of those trading ideas that survives because it is simple enough to explain before the opening bell.
Mark the first few minutes of the session. Draw the high. Draw the low. Buy the break above. Short the break below.
That simplicity has made ORB one of the most searched and most repeated intraday strategies in U.S. trading communities. It also makes the method unusually easy to misunderstand. A clean chart screenshot can make the strategy look inevitable. A real sample of hundreds or thousands of sessions usually looks much messier.
In 2026, that gap between the internet version and the tested version has become especially interesting. Recent large-scale backtests have found that the naive five-minute ORB is close to breakeven after realistic costs. Other studies find that the opening itself still contains valuable information, but only when the breakout is filtered by trend, gap direction, volatility, range width or execution context.
So this article is not another promise that the first breakout of the day is a money printer. It is a practical examination of what the opening range actually measures, why it can matter, why the obvious version often fails, and what a trader would need to test before treating ORB as a real strategy.
What is the Opening Range Breakout?
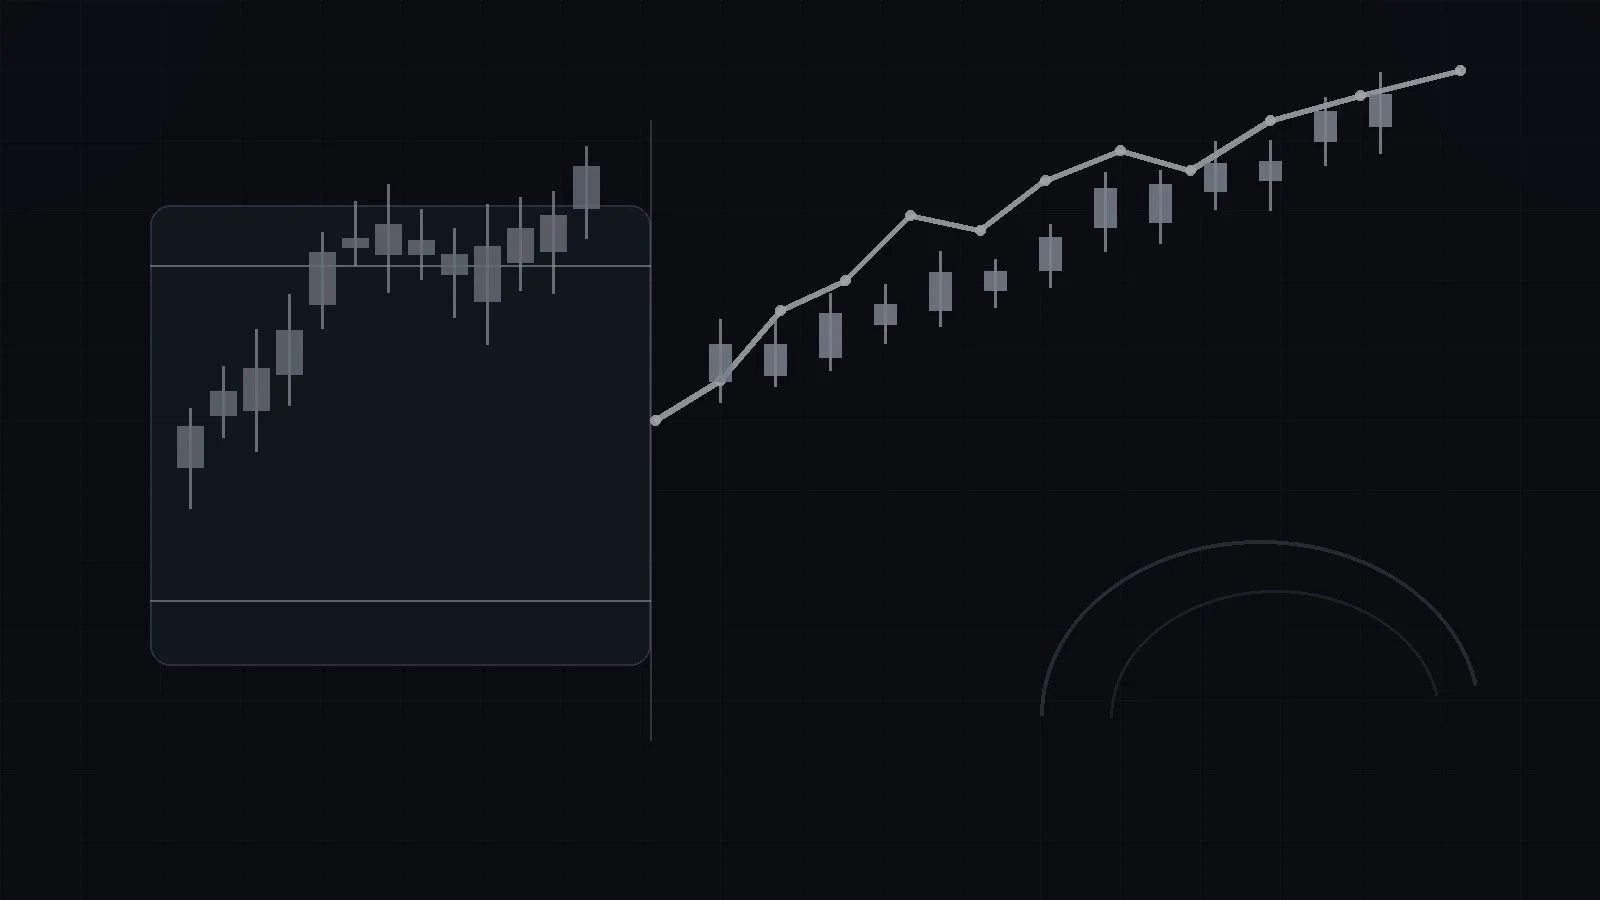
The Opening Range Breakout, usually shortened to ORB, defines a high and low during an initial period after the regular market opens. Traders then use a move beyond that range as a possible signal that the session is transitioning from early price discovery into directional expansion.
For U.S. equities, the core cash session begins at 9:30 a.m. Eastern Time. The opening range can be defined as the first 5 minutes, 15 minutes, 30 minutes or, less commonly, the first hour. Futures traders often anchor the range to the 9:30 a.m. ET cash open even though equity-index futures trade nearly around the clock. That is because the cash open introduces a major change in participation, information processing and order flow.
CME even operates products specifically tied to the official cash index open, which is a useful reminder that the opening print is economically important to institutions, not merely a retail chart convention.
Why the first minutes of the session are structurally different
The opening range is not magical, but the open is structurally different from the middle of the trading day.
Overnight information has to be incorporated into cash prices. Earnings releases, analyst revisions, macro data, overseas market moves and company news all meet a fresh wave of regular-session liquidity. Index funds and institutional portfolios execute opening orders. Market makers adjust inventory. Traders who carried positions overnight reduce or increase risk. Short sellers and momentum traders respond to gaps.
This creates concentrated price discovery.
That is the real intellectual foundation of ORB. The strategy assumes that the first minutes of regular trading reveal something about the balance between urgent buyers and sellers. If one side remains dominant after the initial auction, a break from the early range may be the beginning of a trend rather than random noise.
The problem is that the same opening volatility can also create false signals. High participation means more information, but it also means more stop orders, more aggressive liquidity taking and more reversals.
The classic 5-minute, 15-minute and 30-minute ORB
There is no universal opening-range length.
A five-minute range gives the earliest signal. It also creates the most noise. A fifteen-minute range is slower but usually contains more of the initial auction. A thirty-minute range filters more opening volatility but may enter after a large portion of the day’s move has already occurred.
Most false breaks
Best execution sensitivity
Highest dependence on slippage
Still early in session
Popular with NQ/ES traders
Good compromise for testing
More confirmation
Wider stop distances
Can miss early trend expansion
The correct question is not “which ORB is best?” It is “which definition produces a stable edge on the instrument, session and execution model I actually trade?”
The uncomfortable 2026 evidence: the naive ORB is weak
One of the most useful recent studies tested the classic five-minute ORB across 142,348 simulated trades on 104 liquid U.S. stocks and ETFs from 2020 through August 2026. The reported profit factor was only 1.03 and average expectancy roughly +0.011R per trade before the inevitable uncertainty of real-world execution.
That is basically breakeven.
Another 2026 Nasdaq-futures test found the naive break-either-side version produced a negative in-sample Sharpe and a severe out-of-sample drawdown. Yet a filtered version that aligned direction with the opening move and broader trend produced materially better results.
This distinction is essential. The opening range may contain information even if “buy every break” does not contain enough information to overcome costs.
Why the naive breakout often fails
The first reason is obvious: not every day trends.
Some sessions open, discover a range and then rotate inside value for hours. On those days, both the high and low of an early range can be broken before price returns toward the middle. A mechanical ORB system can therefore be whipsawed twice.
The second reason is execution. The breakout itself is often the moment when spreads widen, market orders accelerate and slippage increases. A backtest that assumes a perfect fill at the range boundary can turn a tiny statistical edge into a fictional one.
The third reason is adverse selection. If everybody can see the same five-minute high, the first tick through it does not tell you whether new information is entering the market or whether stops are simply triggering.
This is where The Kapital’s guide to liquidity sweeps and failed breakouts becomes directly relevant. A breakout can be genuine acceptance or merely a brief excursion through a crowded order level. The response after the break matters more than the wick itself.
Filter #1: the gap
One of the most intuitive ORB filters is the overnight or premarket gap.
If a stock opens significantly above the prior close after a real catalyst and then breaks the opening-range high, the breakout is aligned with an existing repricing process. A short break of the range low on the same stock is fighting that information unless the opening gap is clearly failing.
This does not mean gaps always continue. Many gaps fade. The point is that direction relative to the overnight move contains information that a symmetric break-either-way rule ignores.
A useful test separates at least four cases:
- Gap up + ORB long.
- Gap up + ORB short.
- Gap down + ORB short.
- Gap down + ORB long.
If expectancy is concentrated in the aligned cases, the “ORB edge” is really a continuation edge expressed through the opening range.
Filter #2: broader trend
A five-minute chart can look bullish inside a long-term downtrend. That does not make the breakout invalid, but it changes the probability distribution.
Recent research has found stronger ORB performance when the trade direction agrees with a higher-time-frame trend filter such as price relative to a 200-day moving average. The exact moving average is not sacred. The broader principle is.
A breakout is more credible when multiple time horizons are repricing in the same direction.
Filter #3: opening-range width
Range width is one of the most underappreciated variables in ORB trading.
If the opening range is extremely narrow, the breakout level may be statistically fragile. A few ordinary ticks can trigger the trade. If the range is extremely wide, the opposite side may be too far away to use as a practical stop.
Some recent ORB datasets show a nonlinear relationship between range width and performance rather than a simple “narrow is good” rule. That makes intuitive sense. The range is simultaneously a measure of volatility, uncertainty and required risk.
A serious system should normalize opening-range width by price or ATR rather than use the same dollar threshold on every instrument.
Filter #4: volume and participation
Volume confirmation is popular because a breakout on rising participation feels more credible than a lonely tick above the range.
But volume filters must be tested carefully. A filter that sounds logical can simply remove trades without improving expectancy. One recent study of ORB plus VWAP found that the VWAP condition did not change the actual set of trades in the tested sample, while transaction costs erased the small gross edge.
The lesson is broader than VWAP: every additional condition needs to prove that it adds independent information.
Filter #5: acceptance outside the range
This is the filter I find conceptually strongest.
Instead of entering the instant price touches one tick beyond the range, wait for evidence that the market accepts the new area. That can mean a candle close outside the range, a successful retest, continued volume or simply time spent beyond the boundary.
This sacrifices entry price in exchange for information.
The same logic appears in Market Profile: a price excursion is not the same thing as acceptance. A market that breaks the range high and immediately returns inside is telling a different story from one that builds volume and time above it.
Breakout entry vs retest entry
The classic ORB enters immediately on the break. The retest variation waits for price to return to the broken range boundary and then resume in the breakout direction.
The advantage of the breakout entry is participation. On powerful trend days, there may be no clean retest.
The advantage of the retest is better information and often better risk placement. The disadvantage is lower trade frequency and the possibility that the best trends leave without you.
Neither approach is universally superior. Their P&L distributions are simply different.
Where should the stop go?
Many ORB systems place the stop at the opposite side of the opening range. This is logically clean because a full traversal back through the range contradicts the idea of immediate directional expansion.
But it can also be very wide.
Alternative stops include the range midpoint, the breakout candle low/high, an ATR-based distance or a nearby structural swing. Every choice changes win rate, average loss and position size.
The correct order of operations is to define where the thesis is invalid and then size the position accordingly. The Kapital’s position-sizing guide explains why squeezing a stop merely to justify a larger position reverses the logic of risk management.
ORB targets: fixed R, range extensions or trailing?
Popular targets include 1R, 2R, one full opening-range extension and trailing exits.
A small fixed target increases hit rate but can truncate the very trend days that justify a breakout strategy. A large target captures more convexity but creates long losing sequences.
This is why win rate alone is a poor way to judge ORB.
A strategy with a 42% win rate can be attractive if winners average 2R and losses are controlled. A strategy with a 65% win rate can still lose if average winners are tiny and false breaks create large losses.
If yes, define the directional hypothesis before the open.
Normalize it to ATR or price. Bad geometry can destroy risk/reward.
A close/retest can reduce false-break exposure.
Size from the invalidation distance, not from desired leverage.
ORB on stocks vs ES and NQ futures
The same label hides different microstructure.
A stock with earnings news may open 8% away from the prior close and experience aggressive one-sided institutional repricing. The opening range is embedded inside a company-specific catalyst.
ES and NQ futures trade almost continuously, so the 9:30 a.m. cash open is not the beginning of price discovery from zero. It is a regime change in participation. Futures traders should therefore distinguish overnight structure from the cash-session opening range.
This is why prior-day high/low, overnight high/low and the cash opening range often interact. The ORB is one layer of context, not the whole chart.
Why ORB is especially seductive on NQ
Nasdaq futures can produce rapid directional expansion, making a successful ORB look spectacular. They also produce violent reversals and slippage.
The instrument’s volatility magnifies both the best and worst properties of the method. A tight five-minute range can create excellent asymmetric reward on a trend day. It can also create repeated false breaks when technology stocks rotate aggressively around macro headlines.
A trader who only saves screenshots of the clean NQ trends will dramatically overestimate the strategy.
The overlooked variable: day type
One reason ORB research can look inconsistent is that the method behaves differently across day types. A catalyst-driven trend day and a balanced rotational day are not two samples from the same microstructure.
On trend days, the opening range can act like a compressed launch area: the market digests overnight information, chooses a direction and spends the rest of the session repricing. On rotational days, the opening range is more like the first boundary of an auction that keeps revisiting value. The same breakout entry can therefore represent continuation in one regime and a liquidity grab in another.
A practical test can classify sessions after the fact using objective features such as close location, directional range expansion and time spent away from VWAP. That classification should not be used to cheat the backtest by knowing the future. Instead, it helps identify which observable early-session variables tend to precede the profitable day types.
For example, a large overnight gap, unusually high relative volume, a catalyst and persistent opening imbalance may collectively raise the probability of a trend day. None of those variables guarantees continuation. Together they can create a much more defensible context filter than the opening range alone.
How I would backtest an ORB strategy
A defensible backtest needs rules that can be written before seeing the result.
- Choose one instrument universe.
- Define regular-session open precisely.
- Choose a fixed range duration.
- Define breakout as touch, trade, close or retest.
- Specify gap and trend filters in advance.
- Specify stop and target rules.
- Include commissions and realistic slippage.
- Limit entries per day.
- Separate in-sample and out-of-sample periods.
- Test different volatility regimes.
The most important step is the last one. A strategy that works only during the 2020–2021 momentum environment may not be a stable strategy. It may be a regime artifact.
Common ORB mistakes
Trading every break. The easiest rule is usually the weakest rule.
Ignoring the gap. Overnight repricing can contain more information than the five-minute box.
Using perfect fills in backtests. Breakout execution is where slippage matters most.
Optimizing one stock. Parameter tuning on a single symbol creates fragile conclusions.
Changing range duration after losses. If every drawdown leads to a new five-, ten- or twenty-minute definition, the process becomes hindsight.
Confusing win rate with edge. Expectancy, drawdown and costs matter more.
Oversizing because the setup looks obvious. No visual pattern deserves unlimited confidence.
Does the Opening Range Breakout actually work?
The best answer I can give is more nuanced than the search query wants.
The opening range appears to contain real information because the opening session concentrates price discovery and institutional flow. But the simplest ORB rule — trade every first break of a short opening range — appears too weak to deserve blind confidence.
The edge, when it exists, is more likely to come from context: catalyst, gap direction, trend regime, range width, acceptance and disciplined execution.
That means ORB is better understood as a framework for organizing the open than as a standalone mechanical signal.
Opening Range Breakout FAQ
What is the best opening range for ORB?
There is no universal best duration. Five minutes is fast and noisy, fifteen minutes is a common compromise, and thirty minutes provides more confirmation but later entries. The definition should be tested on the actual instrument and session traded.
Does ORB work on NQ futures?
ORB is widely used on NQ, but results depend heavily on trend filters, stop logic, slippage and session definition. Recent research suggests the naive version is much weaker than filtered versions.
Should I enter immediately on the breakout?
Immediate entry maximizes participation but increases false-break and slippage risk. Waiting for a close or retest sacrifices some price in exchange for confirmation.
What is a false ORB breakout?
A false breakout occurs when price moves beyond the opening range and then quickly returns inside it rather than gaining acceptance outside the boundary.
Is ORB better than VWAP?
They answer different questions. ORB maps early-session range expansion; VWAP measures the session’s volume-weighted average price. A filter should only be used if testing shows it adds independent information.
My conclusion
The Opening Range Breakout survives because the idea contains a genuine market insight: the open matters.
But “the open matters” is not the same claim as “buy the first break and make money.”
The 2026 data are valuable precisely because they make the strategy less romantic. A raw ORB can be close to breakeven. A filtered ORB can be more interesting. Execution can erase a small edge. Trend days make the method look brilliant; rotational days expose its weakness.
If I were building an ORB system from scratch, I would spend less time searching for the perfect opening-range duration and more time defining when I am allowed to trade at all.
That is where the real strategy begins.
Sources and research notes
- CME Group — Trade at Cash Open and the official 9:30 a.m. ET cash-market open.
- TrueTrader — 142,348-trade ORB study, August 2026.
- EdgeLab — 16-year Nasdaq ORB test, July 2026.
- TradingStats — ES/NQ opening-range analysis across 6,142+ sessions.
Educational content only. Day trading and leveraged futures trading can result in substantial losses.