VWAP is one of those trading tools that looks almost insultingly simple. One line moves through the middle of an intraday chart. Price trades above it, below it, crosses it, rejects it, reclaims it. Many traders then reduce the entire idea to a slogan: above VWAP is bullish, below VWAP is bearish.
That shortcut is useful only until it becomes expensive.
VWAP — volume-weighted average price — is not a prediction engine. It is an accounting statement about where trading has actually occurred, weighted by how much volume changed hands. That distinction matters. A moving average asks where price has been. VWAP asks where the market’s traded value has been concentrated since the chosen anchor.
That makes VWAP simultaneously an execution benchmark, a market-structure reference and, in the right context, a trading signal. The hard part is knowing which role matters in the moment.
This guide builds the indicator from first principles and then turns it into a practical framework. We will calculate VWAP, compare it with simple moving averages, examine reclaims, rejection setups and mean reversion, explain why institutional traders care about it, distinguish session VWAP from anchored VWAP, and show why the same line can be useful on one day and almost meaningless on another.
What VWAP actually measures
Nasdaq defines VWAP simply as volume-weighted average price. Interactive Brokers describes it as the average price at which a security traded over a period after weighting each transaction by volume. In other words, a $100 trade involving 100 shares should not influence the average as much as a $101 trade involving 50,000 shares.
The conceptual formula is:
VWAP = cumulative dollar volume / cumulative share volume
Charting platforms often approximate this with bar data. A common implementation uses the typical price of each bar:
Typical Price = (High + Low + Close) / 3
Then:
VWAP = cumulative(Typical Price × Volume) / cumulative(Volume)
The weighting is the entire point. A high-volume price region pulls VWAP toward itself. A thinly traded spike has much less influence.
Why institutions care about VWAP
VWAP matters because it is not merely a retail indicator. It is widely used as an execution benchmark. Nasdaq offers VWAP execution strategies, and Interactive Brokers offers a best-efforts VWAP algorithm designed to seek an average execution close to the benchmark over a chosen period.
Imagine an asset manager needs to buy 500,000 shares. Buying the entire block immediately could push the price higher and reveal the trader’s urgency. Instead, the order may be spread across the session in proportion to expected market volume. At the end, the execution desk can compare its average fill with VWAP.
If the desk bought below VWAP, execution may be considered favorable relative to the day’s volume-weighted market. If it bought materially above VWAP, the desk may have paid too much or encountered adverse market impact.
This institutional use is one reason the level receives attention. It does not mean banks magically defend VWAP tick for tick. It means many participants measure around it, execute around it and evaluate around it. Repeated attention can turn a benchmark into a reference point.
VWAP versus a simple moving average
A 20-period simple moving average gives each closing price the same weight. VWAP does not. Suppose a stock trades ten quiet bars at $50 on tiny volume, then two bars at $51 on massive volume. A moving average may remain close to $50 because most bars occurred there. VWAP can move much more aggressively toward $51 because that is where most shares actually changed hands.
For intraday traders, that difference is important. Volume is not just decoration below the chart. It tells you where participation became economically meaningful.
But VWAP has a limitation that a standard moving average does not: it depends heavily on the anchor. Session VWAP usually resets at the beginning of each trading session. Change the anchor and you change the meaning of the line.
Session VWAP and anchored VWAP are not the same tool
Session VWAP answers: Where has today’s volume-weighted average price been since the session began?
Anchored VWAP answers: Where has the volume-weighted average price been since a specific event or bar I chose?
That event might be an earnings gap, a major breakout, a swing low, a capitulation day or a large news candle.
The distinction is not cosmetic. A trader looking at a stock that gapped 20% after earnings may care about the session VWAP for today’s day trade, while a swing trader may care more about anchored VWAP from the earnings gap because that level approximates the average price paid since the event.
TradingView explicitly distinguishes anchored VWAP by allowing users to choose the starting point. That changes the interpretation from “today’s average participant” to “average participant since this event.”
The first real setup: VWAP reclaim
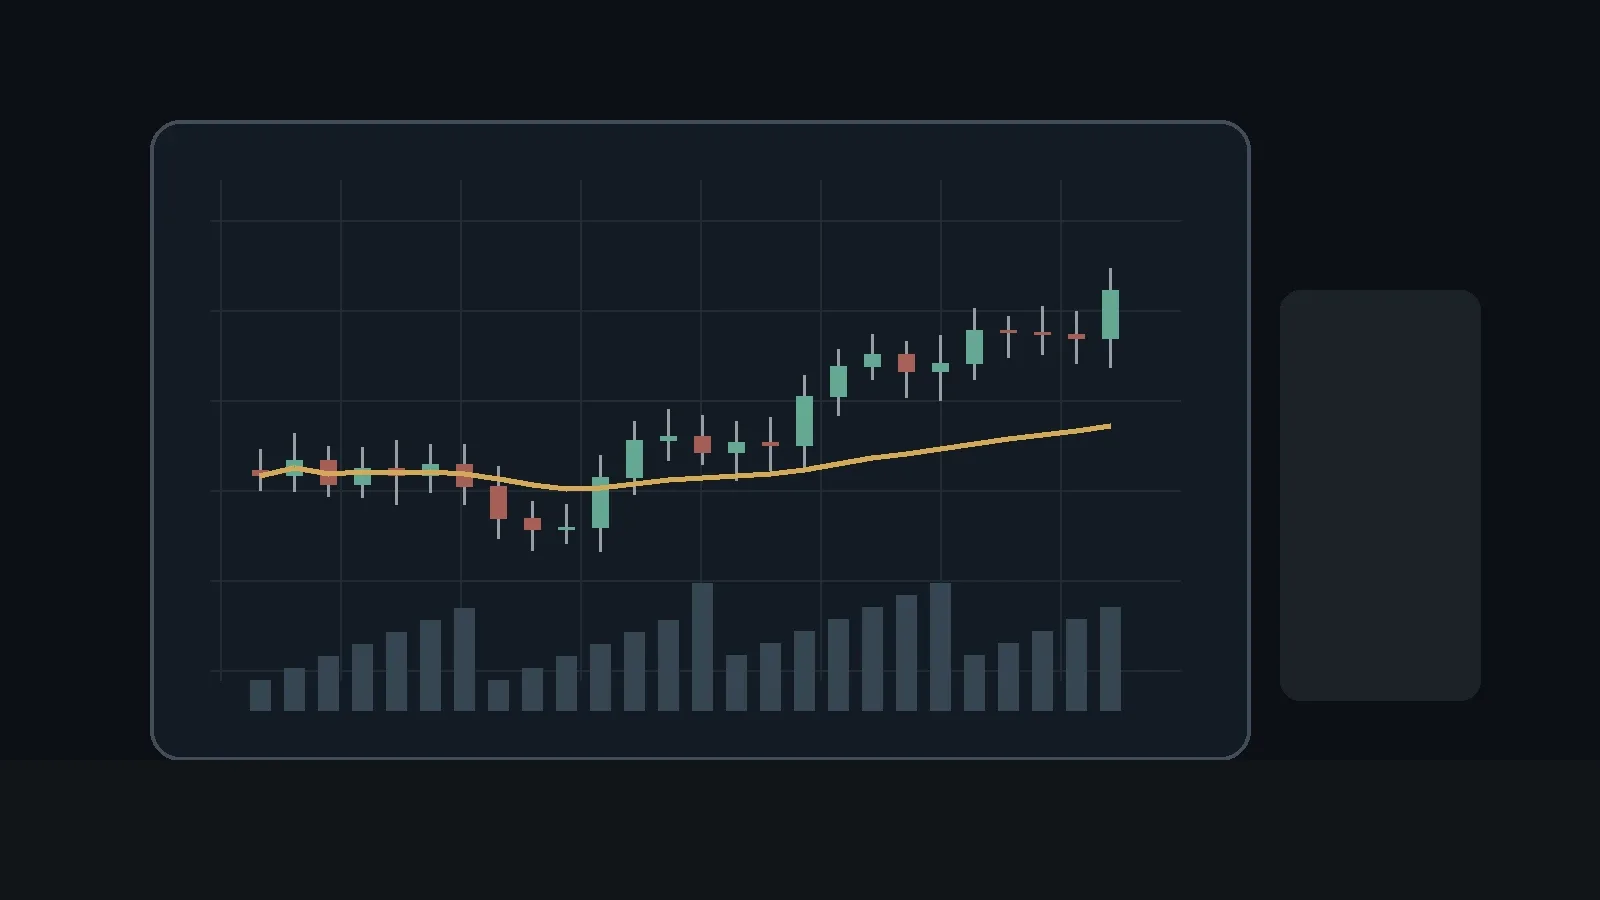
A reclaim occurs when price trades below VWAP, then moves back above it and begins holding there.
The lazy version of the setup is: buy the first candle that closes above VWAP. The better version asks three additional questions:
- Was price previously rejected below VWAP, or did it simply drift through it?
- Did volume expand as price reclaimed the level?
- Did the reclaim also recover nearby structure, such as the opening range, premarket high, a prior intraday pivot or a high-volume node?
Consider a stock that gaps up on earnings. It opens at $42, spikes to $43.20, then sells off to $41.50. VWAP sits at $41.95. Price attempts to reclaim $41.95 three times. The first two fail. On the third attempt, volume increases, price closes at $42.10 and the next pullback holds $41.98 instead of falling back below.
The useful information is not “price crossed a line.” The useful information is the change in acceptance. Sellers had previously controlled trade below VWAP. The market then began accepting prices above it.
This is closely related to the idea of acceptance and rejection discussed in our Market Profile guide. A level matters more when the auction behavior around it changes.
VWAP rejection: the mirror image
On a weak stock, VWAP can act as a reference for failed rallies. Price trades below the line, rallies into it, stalls and then rolls over.
Again, the line itself is not enough. A higher-quality rejection often includes one or more of the following:
- declining volume into the rally,
- a lower high near VWAP,
- heavy selling volume after the rejection,
- a break of the pullback low,
- weakness in the broader sector or index,
- or a failed attempt to recover another important reference level.
If you trade the rejection with a market order during a fast move, execution quality becomes part of the setup. Our article on market orders versus limit orders explains why the theoretical entry price and the actual fill can diverge sharply when liquidity disappears.
Mean reversion to VWAP
VWAP is often used as a mean-reversion target when price becomes stretched far from the session average.
Suppose a liquid stock opens at $80, trends to $84 by midmorning and sits 3.5% above VWAP. A trader might assume it is “too extended” and short simply because distance is large. That is dangerous.
Trend days can remain stretched for hours. A strong catalyst, persistent institutional buying and rising relative volume can keep price far above VWAP much longer than a contrarian expects.
A better mean-reversion framework asks whether the force that created the extension is weakening.
- Is volume fading?
- Are new highs failing?
- Is aggressive buying no longer producing proportional price progress?
- Has the stock lost a short-term trend level?
- Is the broader market reversing?
Only then does VWAP become a plausible destination rather than a magical magnet.
Why VWAP can become useless on a trend day
One of the most expensive VWAP mistakes is assuming the market must return to the line.
On a strong trend day, price may hold above VWAP from the first hour until the close. Every pullback that stops well above VWAP tells you something important: buyers are willing to transact at progressively higher prices without requiring a return to the day’s average.
That is not a signal to keep shorting. It is evidence that the average itself is lagging behind a one-sided auction.
The same logic appears in our Opening Range Breakout analysis. Breakouts work very differently on trend days than on rotational days. VWAP should be interpreted through the same regime lens.
VWAP bands and standard deviation
Some platforms plot bands around VWAP based on standard deviation or percentage distance. Traders use these to visualize extension.
But bands do not solve the regime problem. A two-standard-deviation move is not automatically a short. If volatility has expanded because of material news, yesterday’s concept of “extreme” may no longer apply.
The better use is comparative: how stretched is price relative to the volume-weighted mean, and is the market still accepting that extension?
VWAP and order flow
VWAP becomes more informative when combined with evidence about who is actually trading aggressively.
For example, price reclaims VWAP, but the footprint chart shows strongly negative delta while price refuses to fall. That can suggest passive buyers are absorbing aggressive selling. The reclaim may be more meaningful because it is occurring alongside a shift in auction behavior.
Our Footprint Chart guide explains why delta alone is not directional truth and why absorption matters. VWAP and footprint data answer different questions: VWAP tells you where the volume-weighted average lies; footprint tools show how aggressive buying and selling interacted around that area.
A complete VWAP trade example
Assume a liquid stock closes yesterday at $30 and gaps to $33 after earnings. It opens at $33.40, rallies to $34.10 and then sells off. By 10:15 a.m., session VWAP is $33.25.
Price drops to $32.90, then reclaims $33.25 on increasing volume. The next pullback holds $33.18. The opening-range midpoint sits at $33.20, creating confluence.
A trader could define:
- Entry: $33.30 after evidence the pullback holds.
- Invalidation: below $33.10, where both VWAP and the opening-range midpoint are clearly lost.
- Initial target: $33.80, near the first post-open consolidation.
- Secondary target: retest of $34.10.
Risk per share is $0.20. If the trader’s maximum acceptable loss is $100, theoretical position size is 500 shares before accounting for slippage and fees.
The edge, if any, comes from the combination: catalyst, reclaim, volume expansion, structure and defined invalidation. VWAP is one component, not the thesis.
A counterexample: when the same reclaim is weak
Now imagine a low-volume stock with no catalyst. It drifts under VWAP at lunchtime, crosses above on tiny volume and sits one cent over the line. There is no expansion in activity, no nearby structure, no market-wide momentum and no reason for new participants to care.
Calling that a “VWAP reclaim” is technically accurate and analytically useless.
This is why relative volume matters so much. A signal occurring in a stock trading three times its normal pace deserves a different level of attention from the same signal in a stock trading 40% of normal volume.
The problem of premarket and extended hours
Different platforms can calculate VWAP differently depending on whether premarket and after-hours volume are included.
This can create visible discrepancies. One trader may be using regular-session VWAP while another is using an extended-hours calculation. Both lines can be mathematically valid and strategically different.
For US equities, decide in advance which session definition fits your process. If your strategy focuses on the official regular session, a VWAP anchored at 9:30 a.m. Eastern may be more consistent. If the entire thesis begins with a 7:00 a.m. news release and heavy premarket trading, an extended-hours or event-anchored reference may contain more information.
The biggest VWAP mistakes
1. Treating every cross as a signal
Balanced markets can cross VWAP dozens of times. Without structure and context, a cross is noise.
2. Fading every extension
Strong trend days can remain extended for most of the session. Distance alone is not reversal evidence.
3. Ignoring volume quality
A reclaim on weak participation is not equivalent to a reclaim during expanding, abnormal volume.
4. Forgetting the anchor
Session VWAP, premarket-inclusive VWAP and anchored VWAP can all display different values. Know what your platform is calculating.
5. Assuming VWAP is support because institutions use it
Institutional benchmarking does not imply a guaranteed institutional bid at the line.
How I would build a VWAP playbook
A practical playbook should define the environment before the setup.
- Identify whether the stock has a real catalyst.
- Measure current and relative volume.
- Classify the day as trending, rotational or unclear.
- Mark session VWAP and any relevant anchored VWAP.
- Map nearby structure: opening range, premarket high/low, prior close, key intraday pivots.
- Wait for acceptance or rejection rather than a one-tick touch.
- Define invalidation before entry.
- Size the position from risk, not conviction.
- Track the setup separately in your journal to determine whether VWAP adds measurable value.
The last step is the one most traders skip. An indicator can feel useful for years without ever proving that it improves expectancy.
VWAP as a benchmark, not a prophecy
The most sophisticated way to use VWAP is also the least dramatic. Treat it as a benchmark around which you ask better questions.
Who is profitable above the line? Who is trapped below it? Did price reclaim the average because real demand arrived or because volume disappeared? Is the market rotating around fair intraday value, or is it abandoning yesterday’s idea of value entirely?
Those questions turn VWAP from a colored line into a map of positioning.
FAQ
Is VWAP bullish or bearish?
Neither by itself. Price above VWAP indicates that the current price is above the session’s volume-weighted average, while price below VWAP indicates the opposite. Whether that is tradable depends on trend, volume, catalyst and structure.
Does VWAP reset every day?
Session VWAP generally resets at the beginning of the chosen session. Anchored VWAP begins from a user-defined event or bar and can extend across multiple sessions.
Is VWAP better than a moving average?
They answer different questions. VWAP incorporates volume weighting and is especially useful intraday. A moving average gives equal weight to the chosen price input across bars.
Can VWAP be used for swing trading?
Anchored VWAP can be useful for swing traders when anchored to meaningful events such as earnings gaps, breakouts or capitulation lows. Session VWAP is primarily an intraday reference.
Why does my VWAP differ from another platform?
Differences can come from session settings, data feeds, whether extended hours are included, the price source used in bar calculations and the chosen anchor.
Conclusion
VWAP survives because it compresses an enormous amount of trading activity into one understandable reference: the average price weighted by participation.
But the line is not an edge by itself.
A reclaim can be powerful when it marks a real shift in acceptance. A rejection can matter when a weak stock fails at a level watched by many participants. Mean reversion can work when momentum decays. And all three ideas can fail badly when the day’s regime does not match the setup.
The professional question is therefore not, “Is price above or below VWAP?”
It is: What does the market’s behavior around the volume-weighted average tell me about who is in control, who is trapped and whether the current price is being accepted?
Sources
- Nasdaq: VWAP definition
- Nasdaq: Execution algorithms and VWAP strategy
- Interactive Brokers: VWAP algorithm documentation
- TradingView: Volume Weighted Average Price calculation and usage
Educational content only. Not investment advice.