Research date: August 22, 2026. Educational content only; not investment advice.
VWAP trading begins with a deceptively simple question: at what average price has today’s volume changed hands? The volume-weighted average price answers by giving heavy trading more influence than light trading. It is widely used as an execution benchmark, an intraday reference and a building block for algorithms. It is also misused as if a line could predict every reversal.
I view VWAP as a measure of location, not direction. It tells us where current price sits relative to the session’s volume-weighted history. Above it, the average long participant since the start of the calculation is broadly in profit; below it, that participant is broadly under water. This creates useful context. It does not make every touch support or every cross a trend change.
What Is VWAP in Trading?
VWAP stands for volume-weighted average price. In its common intraday form, it accumulates the value of transactions from the session open and divides by accumulated volume. Most charting platforms approximate each bar’s price with a typical price—often high plus low plus close divided by three—then multiply that value by bar volume.
The running formula is:
VWAP = cumulative sum of price × volume / cumulative volume
If a stock trades 1,000 shares at $50 and 9,000 shares at $51, the volume-weighted average is $50.90, not $50.50. The high-volume price dominates because more capital changed hands there. Real platforms compute the measure across many observations, but the principle is identical.
Standard session VWAP resets each day. That reset distinguishes it from a moving average, which rolls continuously through prior bars. It also means the early-session line is built from little data and can move sharply. By the close, it summarizes the full regular session under the platform’s chosen rules.
Why Institutions Care About VWAP
Large orders create market impact. A fund that needs to buy millions of shares cannot assume the full size is available at the best displayed offer. An immediate order may lift multiple levels and raise the cost of its own purchase. Execution algorithms therefore split parent orders into smaller child orders over time.
A VWAP strategy attempts to distribute execution in line with an expected volume curve so the final average price compares favorably with the market’s VWAP. For a buy order, paying less than the benchmark is generally favorable; for a sell order, receiving more is favorable. This makes VWAP an ex-post scorecard as much as a chart indicator.
That distinction undermines a popular myth. Institutions do not universally “defend” the live chart line. Some algorithms target VWAP, others target arrival price, percentage of volume, implementation shortfall or closing auctions. Their direction differs, and their urgency changes. VWAP matters because it is a common benchmark, not because every large participant places the same trade at the same price.
How VWAP Behaves Through the Session
U.S. equity volume often follows a U-shaped curve: active near the open, quieter around midday and active again near the close. Because VWAP is cumulative, the heavy opening period gives the line an early anchor. Later trades move it more slowly as the denominator grows.
This creates three distinct environments:
- Open: price discovery is fast, spreads can widen and VWAP is unstable because the sample is small.
- Midday: the line stabilizes, but lower volume can produce false crosses in narrow ranges.
- Close: VWAP is statistically mature, while closing flows and benchmark activity can create large volume.
A strategy that treats all three periods identically ignores how the measure is built. The same five-cent cross can mean noise at 9:35 a.m., balance at noon or a meaningful loss of control at 3:30 p.m.
VWAP as a Trend Filter
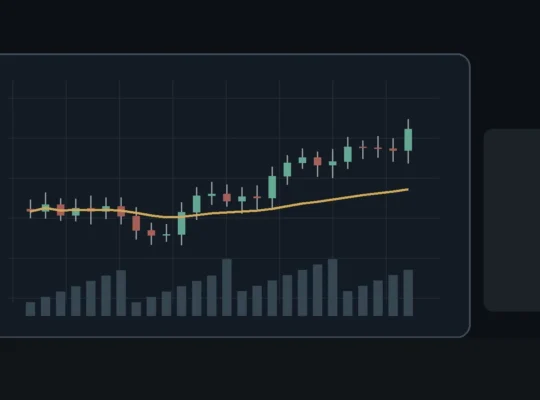
The simplest use is descriptive. Price persistently above a rising VWAP suggests buyers have maintained control of the session’s auction. Price persistently below a falling VWAP suggests the opposite. The slope and the character of tests matter more than a single cross.
On a trend day, pullbacks may approach VWAP and turn before reaching it because participants accept higher prices. On a balanced day, price may cross repeatedly as the line acts more like a center of gravity. On a shock day, price may remain far from VWAP because old transactions no longer represent current information.
I therefore classify the day before choosing a tactic. A mean-reversion trade toward VWAP makes sense only when the market is rotating. Fading a strong catalyst-driven trend merely because price is “too far” from the average confuses an average with a ceiling.
Three Practical VWAP Setups
1. Trend Pullback
Price establishes higher highs above a rising VWAP, then retraces on lighter volume. The trader waits for rejection near the line and defines invalidation below the pullback structure. The thesis is not “VWAP always holds.” It is that an established trend has returned to a widely observed execution reference without evidence of broad distribution.
2. VWAP Reclaim
A stock opens weak, trades below VWAP, then recovers the line with expanding participation. A later retest holds from above. The first cross is information; the successful retest is confirmation. Failed reclaims are common, especially when the broader index remains weak.
3. Mean Reversion
In a balanced session, price stretches far from VWAP without a new catalyst, momentum stalls and the auction begins returning toward the mean. This setup needs an extension measure—such as standard-deviation bands or average true range—and a clear reason the session is rotational rather than directional.
These setups can conflict. A pullback trader buys near VWAP during a trend; a mean-reversion trader may sell an extension toward it during balance. The indicator does not choose the regime. The trader must.
VWAP Bands and Statistical Extension
Many platforms plot bands around VWAP based on standard deviation. They help describe how far price has moved from the session’s weighted mean. A touch of a second band, however, is not automatically a reversal signal. Financial returns are not perfectly normal, intraday variance changes, and news produces fat-tailed moves.
Bands work best as context for profit taking, stop placement and regime recognition. Repeated acceptance near an upper band can indicate a powerful trend. A quick excursion followed by a return inside may indicate failed expansion. The response again matters more than the touch.
Anchored VWAP Explained
Anchored VWAP extends the calculation from a chosen event instead of resetting every session. Common anchors include an earnings gap, a major low, an IPO, a breakout or a policy announcement. The line estimates the volume-weighted average price since that event under the platform’s data.
The economic intuition is attractive: it approximates the average cost basis of participants since a meaningful reset in information. If price returns to an earnings-anchored VWAP, many post-event buyers are near breakeven. Their decisions can create supply or demand.
But anchor selection introduces discretion. A trader can attach a line to almost any turning point after the fact. To avoid that trap, define eligible events in advance and keep a limited set of anchors. More lines do not create more truth; they create more opportunities to find a coincidental touch.
VWAP Versus Moving Averages
VWAP weights by volume and normally resets; a simple moving average weights each closing price equally across a rolling window. An exponential moving average gives recent prices greater weight but still ignores volume. These are different questions.
- VWAP: Where is the average transacted price since the session or anchor?
- SMA: What is the unweighted average of recent closes?
- EMA: What is the recent-price-weighted average?
For intraday execution and cost basis, VWAP has the clearer interpretation. For continuous multiweek trend analysis, moving averages may be easier. Anchored VWAP bridges the two but remains event-dependent.
What VWAP Does Not Show
VWAP does not reveal who bought, whether a trade opened or closed a position, or whether a participant was hedging. It does not show the distribution of volume around the mean; a single average can represent one tight cluster or two distant clusters. Volume profile answers that different question.
It also does not guarantee executable liquidity at the line. A stop order triggered during a fast cross can fill materially away from the charted price. Investor.gov emphasizes that market-order execution prices are not guaranteed and that large orders can fill at several prices.
Finally, VWAP is not fundamental value. A stock can remain below VWAP while still being expensive on cash flow, or above VWAP while being cheap. For the valuation channel behind market repricing, our analysis of bond yields and growth-stock valuation is the relevant framework.
Data and Platform Differences
Two VWAP lines can differ because platforms use different sessions, volume sources or price inputs. U.S. consolidated equity volume differs from a single venue. Forex has no centralized tape. Crypto VWAP varies by exchange. Futures are centralized by contract but roll and session settings matter.
Extended-hours inclusion is especially important for stocks. An earnings release can produce heavy after-hours volume. A regular-session VWAP will ignore it, while an extended-session calculation will not. Neither is universally correct; each answers a different question. The trader must know which line is displayed.
Risk Management for VWAP Trades
A stop should reflect the failure of the setup, not an arbitrary distance from VWAP. For a pullback, invalidation may sit below the structural low that produced the bounce. For a reclaim, it may sit below the retest. For mean reversion, it may sit beyond the extension that would indicate a genuine trend.
Position size follows from that distance. If the logical stop is $0.50 away and the account can risk $100, the theoretical size before fees and slippage is 200 shares. If the stop must be $1 away, size falls to 100. Moving a stop closer solely to preserve size changes the strategy.
News can make VWAP temporarily irrelevant. Earnings, inflation data and central-bank decisions change the information set abruptly. A price far above VWAP may be rational because the earlier volume occurred before the news. In those conditions, the line measures history more than equilibrium.
Common VWAP Mistakes
Buying every touch. VWAP is a reference, not automatic support.
Ignoring slope. A rising, repeatedly defended line differs from a flat line crossed ten times.
Trading too early. The calculation is least stable when it contains the least data.
Using it on thin markets. Sparse prints and wide spreads weaken the benchmark’s meaning.
Mixing session settings. A strategy tested on regular hours cannot be assumed to behave the same with overnight data.
Confusing benchmark with forecast. VWAP describes achieved prices; it does not predict the next catalyst.
How I Would Test a VWAP Strategy
Define the instrument universe, session, data source and entry logic precisely. “Buy near VWAP” is not testable. “After 10:00 a.m., buy the first pullback that touches a rising regular-session VWAP after price has held above it for thirty minutes, with index confirmation” is closer.
Include spreads, commissions, partial fills and slippage. Separate gap days, earnings days and ordinary sessions. Compare the result with simple trend and mean-reversion baselines. Test on liquid and less-liquid securities. Most important, keep an untouched period for validation.
Context outside the indicator also matters. Our Bitcoin macro deep dive shows how liquidity, yields and the dollar can influence a continuously traded market. No VWAP rule should pretend those forces disappear at a line.
My Bottom Line
VWAP deserves its place on trading screens because its calculation has a clear economic meaning and a real role in execution. It tells us where volume has transacted on average, offers a shared benchmark and helps distinguish trend from balance.
Its strength is also its limit: VWAP summarizes the past. It does not know why participants traded, whether new information has arrived or where price must go next. Use it to define location, combine it with regime and structure, verify platform settings, and size risk from invalidation. A benchmark becomes dangerous only when treated as an oracle.
Frequently Asked Questions
Is price above VWAP always bullish?
No. It suggests the session is trading above its volume-weighted average, but slope, time, catalyst and market structure determine whether that condition is useful.
Does VWAP reset every day?
Standard session VWAP normally does. Anchored VWAP begins at a user-selected event and can continue across many sessions.
Is VWAP better than an EMA?
Neither is universally better. VWAP is better suited to transaction-weighted intraday location; an EMA is a continuous recent-price trend measure.
Can swing traders use VWAP?
Yes, usually through anchored VWAP tied to a meaningful event such as earnings, a major low or a breakout.