Research date: August 22, 2026. Educational content only; not investment advice.
A liquidity sweep in trading is a fast move through an obvious price level where orders are likely to cluster, followed by a test of whether the market accepts the new price or snaps back. That sounds simple. Online, however, the idea is often wrapped in a much larger story: institutions allegedly see every retail stop, deliberately push price through it, and then reverse the market on command. I think that story is too neat. The observable event is real; the claimed motive is usually unknowable.
The useful way to study a liquidity sweep is therefore not as a secret signal but as a small market-microstructure problem. Where was liquidity likely to be? What orders became active when price crossed the level? Did aggressive trading find enough opposite-side interest to continue, or did it exhaust itself? Most important, what happened after the level traded? A sweep is evidence that an auction reached a crowded area. It is not evidence that the next candle must reverse.
What Is a Liquidity Sweep in Trading?
Markets need counterparties. A buyer who wants immediate execution trades against available sell orders; a seller who wants immediate execution trades against available buy orders. Around visible highs, lows, round numbers, session boundaries and range edges, several order types can accumulate at once. A prior high may attract breakout buy orders and stop orders from short sellers. A prior low may collect breakout sells and protective stops from long holders.
When price moves through one of those zones, the newly activated orders can accelerate the move. Traders call that event a liquidity sweep, stop run, stop hunt or liquidity grab. Those labels overlap, but they are not perfectly identical. “Sweep” describes price trading through a pool of orders. “Stop run” emphasizes triggered stops. “False breakout” describes the outcome when the move cannot hold. Only the last of these can be known after acceptance fails.
The SEC’s order-type guidance provides an important mechanical anchor: a stop order becomes a market order once its trigger is reached, and its execution price is not guaranteed. During a fast move, triggered stops can consume several price levels. That does not prove manipulation. It shows how a crowded level can produce a burst of urgent flow and slippage.
Buy-Side and Sell-Side Liquidity
“Buy-side liquidity” normally means executable buying interest above the current market. It can include buy stops from short sellers and stop-entry orders from breakout traders. Equal highs, the prior day’s high, a premarket high and a round number are common candidates. If price pushes above them, those orders can become marketable at roughly the same time.
“Sell-side liquidity” is the mirror image below the market: sell stops from long positions, breakdown entries and other sell orders near an obvious low. The vocabulary can be confusing because buy-side liquidity is not a bullish forecast and sell-side liquidity is not a bearish forecast. The terms describe the side of the book likely to become active, not the direction that must follow.
This distinction matters. A move above a prior high may trigger buying and then continue because fresh demand overwhelms available supply. The same move may reverse because the triggered buying is absorbed by larger passive sellers. The location looks identical until the response reveals which auction occurred.
The Market-Microstructure Logic Behind a Sweep
Imagine a stock trading below a clearly visible weekly high. Short sellers often place protective buy stops just above that high. Momentum traders may place buy-stop entries there too. As price approaches, aggressive buyers lift offers. The level breaks, dormant orders activate, and the tape speeds up. Three outcomes are possible.
- Acceptance: price remains above the level, volume follows, pullbacks hold, and the breakout becomes genuine.
- Rejection: price trades above the level but quickly falls back below it, trapping late buyers and forcing some of them to exit.
- Unresolved auction: price whipsaws around the level, offering no clean evidence of control.
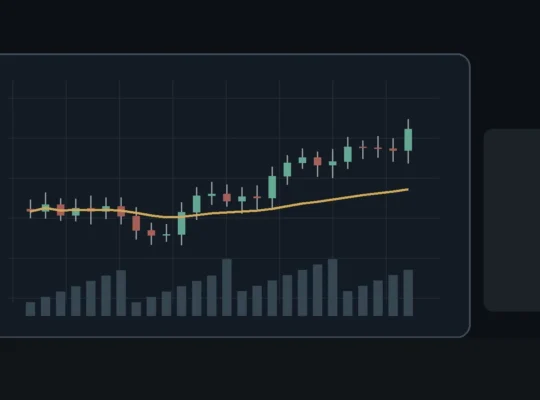
The second outcome is what many traders mean by a bearish liquidity sweep. Yet the crucial information is the reclaim of the old range, not the wick by itself. A wick shows range. A reclaim shows that the market could not maintain trade beyond the boundary.
The same logic applies below a low. A quick break activates sell orders. If price immediately recovers the level and then holds above it, forced selling may have met patient demand. If price cannot recover, calling the move a “liquidity grab” becomes a way of denying a real breakdown.
Liquidity Sweep Versus a Normal Breakout
A breakout trader and a sweep trader often watch the same level but demand different confirmation. The breakout trader wants expanding participation, time spent beyond the level and a successful retest from the other side. The fade trader wants a failed auction: penetration, rejection, reclaim and evidence that the initiating side is trapped.
I use four questions to separate the two:
- How far did price penetrate? A minimal tick through a high may be noise; a large extension followed by a full reversal carries more information.
- How long did price remain outside? Acceptance is partly a function of time. Several closes beyond a level are harder to dismiss than one wick.
- What did volume and range do? A breakout with expanding volume and broad candles differs from a spike that immediately contracts.
- Where is invalidation? If the old range is reclaimed but price later closes back beyond the sweep extreme, the fade thesis has failed.
This framework avoids hindsight. The level is marked first, the acceptable evidence is defined first, and the trade—if any—is evaluated against a condition that can be disproved.
Why “Institutions Hunt Your Stops” Is Usually the Wrong Model
Large traders do care about liquidity because size is expensive to execute in thin markets. But it does not follow that a single institution knows an individual trader’s stop or controls the entire auction. Modern U.S. equities trade across multiple venues, brokers internalize some flow, hidden orders exist, and public depth is incomplete. Even in centralized futures, displayed orders can be added or canceled.
The more defensible claim is modest: obvious reference points attract similar decisions, and concentrated decisions create liquidity. A large participant seeking to buy may prefer an area where forced sellers appear, because those sellers provide the other side. That is economic logic, not proof of a conspiracy.
This nuance protects traders from a costly mental habit. If every loss is blamed on a stop hunt, the trader never tests whether the entry was late, the stop was inside normal volatility, the position was oversized or the broader trend contradicted the setup.
How to Identify a Higher-Quality Liquidity Sweep
A credible candidate begins with a level other participants can see without creative drawing. Prior session highs and lows, weekly extremes, opening ranges, repeated equal highs or lows, and major round numbers qualify. A diagonal line adjusted after every candle does not.
Next comes the approach. A slow, compressed move into a level may store orders and create a sharp reaction. A violent trend arriving with broad ranges may simply break through. Context matters more than the visual neatness of the level.
Then watch the response. For a bearish setup above a high, a clean sequence is penetration, failure to extend, return below the level, and inability to reclaim it from underneath. For a bullish setup below a low, reverse the logic. Confirmation can come from a close, a retest, an order-flow shift or a break in the smallest relevant swing structure. None guarantees success; each reduces ambiguity.
Finally, place the event inside the larger regime. Fading a five-minute high during a powerful daily uptrend is different from fading the top of a multiweek range. A sweep that aligns with higher-time-frame resistance may be a setup. One that fights persistent trend and news-driven flow may be only a pause.
A Practical Workflow Without Magical Thinking
- Map levels before the session. Mark only obvious highs, lows, gaps, opening references and round numbers.
- Define the expected response. Decide what constitutes acceptance, rejection and invalidation before price arrives.
- Wait for the reclaim. Entering during the spike confuses an event with a completed setup.
- Size from the invalidation distance. A wider logical stop requires fewer shares or contracts.
- Record continuation as carefully as reversal. A journal that saves only beautiful reversals creates false confidence.
Suppose an index future breaks the prior day’s low by five points, rebounds above it, holds the retest, and recovers the session VWAP. A trader might define the sweep low as invalidation and the opposite side of the morning range as a target. That is a complete hypothesis. “It swept liquidity, so it must rally” is not.
Liquidity Sweeps Across Stocks, Futures, Forex and Crypto
The mechanism travels across markets, but the data quality and session structure change. U.S. stocks have a dominant cash session, opening and closing auctions, premarket references and fragmented venues. Index futures trade nearly around the clock, but the U.S. cash open still changes participation. Forex has overlapping regional sessions and decentralized data. Crypto trades continuously, with different exchange books and visible liquidation levels in leveraged derivatives.
That means a “prior session high” is not universal. A futures trader may separate overnight and regular trading hours. A crypto trader must choose an exchange and a daily cutoff. A stock trader should recognize that a low-volume premarket wick may not carry the same information as a regular-session high formed on substantial volume.
Macro context can overwhelm any local pattern. For an example of how yields, the dollar and regulation can pull on the same market, see our analysis of Bitcoin’s rally near $80,000. The lesson is not that macro always wins instantly, but that chart labels do not erase the forces driving participation.
Common Mistakes
Calling every wick a sweep. Normal volatility produces countless wicks. A useful sweep needs a preidentified liquidity area and a meaningful response.
Assuming reversal. A sweep can be the first stage of continuation. Acceptance outside the level is evidence against the fade.
Moving the level after the fact. If the line changes to fit the reversal, the analysis cannot be tested.
Ignoring execution. Stop orders can become market orders and fill far from the trigger in fast conditions. A chart-perfect stop does not guarantee chart-perfect risk.
Using fixed size. Two setups with different invalidation distances should not automatically use the same number of shares.
Confusing a narrative with data. “Smart money entered here” is not observable unless the trader has specific evidence. Price, volume, time and execution are observable.
How I Would Test the Idea
A serious test must define the level, penetration, reclaim, entry, stop, target, session and instrument in advance. It should include transaction costs and slippage, especially because sweeps occur when execution can deteriorate. Results should be separated by trend regime, volatility and time of day.
I would also compare the setup with a simple baseline. Does “sweep plus reclaim” outperform buying or selling an ordinary range break? Does adding VWAP alignment improve results, or merely reduce sample size? Does performance survive different years and instruments? If the edge disappears after modest costs or depends on one market phase, it is not robust.
This is the same discipline investors need when translating market conditions into valuation. Rising discount rates, for example, affect long-duration assets through explicit mathematics, as explained in our guide to why rising bond yields hurt growth stocks. A trading concept deserves the same demand for a causal mechanism and falsifiable evidence.
Risk Management Matters More Than the Label
Even a well-defined sweep can fail. The most important variable is not whether the label is correct but whether one failed hypothesis can damage the account. Risk should be set in dollars first, then translated into size using the distance between entry and invalidation. Stops should sit where the thesis is wrong, not where the desired position size becomes convenient.
Traders should also account for gap and slippage risk. A stop is a trigger, not a guaranteed exit price. Around earnings, economic releases and thin trading, realized loss can exceed planned loss. Short options and leveraged futures add further nonlinear or margin risk.
My conclusion is deliberately unsensational: liquidity sweeps are a useful way to describe how price behaves around crowded levels. They become dangerous when transformed into proof of institutional intent or a guaranteed reversal. Mark the level beforehand, wait for evidence, define invalidation, size conservatively and keep the explanation smaller than the data.
Frequently Asked Questions
Do liquidity sweeps always reverse?
No. Some reverse, some continue and some produce noise. A reclaim of the prior range supports a reversal thesis; sustained trade beyond the level supports acceptance.
Is a liquidity sweep the same as a stop hunt?
The terms are often used interchangeably. “Stop hunt” implies intent, while “liquidity sweep” can remain a neutral description of price trading through a zone where orders cluster.
What time frame works best?
No time frame is universally best. Lower time frames create more signals and more noise. Higher time frames produce fewer events but often clearer levels. The time frame must match the holding period and execution method.
What confirms a liquidity sweep?
Common confirmation includes a quick reclaim, failure on retest, a small structural break, and participation consistent with rejection. Confirmation reduces uncertainty but never eliminates risk.