Research date: August 22, 2026. Educational content only; not investment advice.
A fair value gap in trading is a three-candle chart pattern used to mark a fast, one-sided move in which the first and third candles do not overlap across part of their ranges. Traders interpret the untraded-looking zone between them as an imbalance that price may revisit. The pattern has become central to “smart money concepts,” yet its name causes confusion: it is not an accounting estimate of fair value, it is not necessarily an exchange-level gap, and it does not prove that institutional orders remain waiting inside the box.
I find the concept useful only after stripping away those claims. A fair value gap, or FVG, is a visual shorthand for displacement. Price moved so quickly that a simple candle chart shows limited two-way overlap. That can help organize a chart. It cannot tell us, by itself, whether the move was informed, whether the zone contains latent demand, or whether price will return.
What Is a Fair Value Gap in Trading?
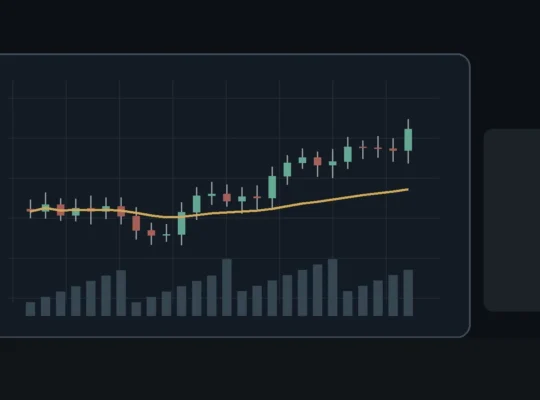
The standard bullish FVG uses three consecutive candles. If the high of candle one is below the low of candle three, the space between those two prices is marked as the gap. The large middle candle usually drives the displacement upward. A bearish FVG reverses the geometry: the low of candle one remains above the high of candle three after a strong downward middle candle.
Traders often call a later return into that area a “fill” or “mitigation.” A complete fill reaches the opposite boundary; a partial fill enters only part of the zone. Some watch the midpoint, sometimes called consequential encroachment. None of these labels changes what the chart records: a past interval with little candle-range overlap.
That last phrase is deliberate. Candles compress thousands of messages, quotes and trades into four prices. A three-candle gap on a five-minute chart does not mean no trade occurred in the zone. In many continuous markets, transactions occurred there during the middle bar. The FVG is therefore not an empty order book rendered visible. It is a bar-based representation of speed and directional imbalance.
Fair Value Gap Versus a Traditional Price Gap
A traditional gap occurs when one trading period opens above the prior period’s high or below its low, leaving a literal discontinuity between sessions or bars. Earnings announcements frequently create such gaps in stocks because information arrives while the regular market is closed. A fair value gap can appear during continuous trading with no discontinuity at all.
The difference is material. A session gap reflects a jump between two observed trading periods and may contain little or no regular-session trading. An FVG is inferred from the relationship among three candle ranges. Treating the two as identical exaggerates the evidence carried by the FVG.
Both can nevertheless identify reference zones. Traders remember where a market moved abruptly, where participants may be trapped, and where a catalyst changed the accepted price. The chart can make those memories self-reinforcing, but that is not the same as a mechanical obligation to fill.
Why Fast Moves Leave Visible Imbalances
Prices move when urgent orders consume available liquidity faster than it replenishes. Around earnings, economic releases, liquidations or a technical breakout, marketable orders may lift successive offers or hit successive bids. The SEC reminds investors that market orders seek immediate execution but do not guarantee price; large or urgent orders can fill across several levels. That basic mechanism helps explain why displacement bars become wide.
After the initial shock, two forces can bring price back. First, early participants take profit. Second, traders who missed the move wait for a more favorable entry. The prior displacement zone becomes a convenient map for both groups. If the original information remains powerful, the return may be shallow. If the move was an overreaction, price may cross the entire zone.
This creates a plausible reason FVGs sometimes matter without assuming a hidden institutional order sits at the midpoint. Markets revisit prior fast-travel zones because auctions retest uncertain prices. They also ignore them when new information continues to dominate.
How Traders Define and Draw an FVG
For a bullish setup, label the three bars A, B and C. Bar B is the displacement candle. If A’s high is below C’s low, draw a rectangle from A’s high to C’s low and extend it forward. For a bearish setup, draw from C’s high to A’s low when A’s low is above C’s high.
The definition sounds objective, but discretionary choices enter quickly:
- Should wicks or candle bodies define the boundary?
- How large must the middle candle be relative to recent volatility?
- Does any non-overlap qualify, or must it exceed a minimum percentage of ATR?
- How long does the zone remain valid?
- Does a partial touch, midpoint touch or full traversal count as filled?
A testable approach must answer these questions before reviewing outcomes. Otherwise the analyst can preserve successful zones and quietly delete failed ones.
Displacement Is the Signal; the Rectangle Is the Memory
The strongest FVGs usually appear after a meaningful change: a break from balance, a surprise, a liquidation or a decisive structural move. The gap is less informative when it forms in the middle of noisy congestion. I therefore begin with displacement, not the box.
A displacement move should be large relative to recent bars, close near its extreme, and travel through a level that mattered before the move. Participation should be credible for the market and time of day. In stocks, a wide bar on heavy regular-session volume after earnings is different from a thin premarket print. In futures, a move during the U.S. open differs from an overnight drift.
The rectangle then becomes a memory of where the auction moved too quickly to establish prolonged balance. When price returns, the question is whether the original directional side reasserts control. That response—not the existence of the box—determines whether the zone has practical value.
Fair Value Gaps and Liquidity Sweeps
FVG traders often combine the pattern with a liquidity sweep. A hypothetical bullish sequence runs below a prior low, triggers sell orders, reverses with a broad bullish displacement candle, leaves an FVG and breaks a minor swing high. The trader then waits for price to retrace into the FVG while holding above the sweep low.
This is more coherent than buying every gap because the components answer different questions. The prior low defines where orders may have clustered. The reversal shows rejection. The displacement shows initiative. The FVG maps a possible retracement area. The sweep extreme supplies invalidation.
Still, stacking labels does not automatically create an edge. Several correlated descriptions of the same large candle can create the illusion of independent confirmation. A robust test must determine whether each filter adds information.
How to Trade an FVG Without Treating It as a Prediction
- Start with context. Identify trend, range, catalyst and higher-time-frame levels.
- Require meaningful displacement. Ignore tiny gaps produced by ordinary noise.
- Mark the zone consistently. Use one wick/body rule and one fill definition.
- Wait for a return. Do not chase the middle candle simply because a gap formed.
- Demand a response. Look for rejection, renewed volume, a reclaim or a smaller structural break.
- Place invalidation beyond market structure. The gap boundary alone may be too arbitrary.
- Size from risk. A wider stop means a smaller position.
Consider a stock that gaps higher after earnings and then builds a bullish FVG during the first hour. A later retracement reaches the zone. If price slows, holds the post-earnings breakout and resumes higher, the FVG has functioned as a useful location. If price cuts through on expanding sell volume, the original displacement is being unwound. The label should never override that evidence.
Fair Value Gap Versus Volume Imbalance
These terms are sometimes mixed, but they refer to different data. An FVG is calculated from candle ranges. A footprint-chart imbalance compares executed volume at the bid and ask across price levels. A volume profile shows how much volume traded at each price over a period. An order-book imbalance compares displayed resting liquidity.
Each view compresses the market differently. The FVG is widely available and visually simple, but low resolution. Footprint and order-book data offer more detail yet still have limitations: classification rules can differ, displayed orders can be canceled, and data from one venue may not represent the whole market.
Calling a candle-based FVG an “order-flow imbalance” therefore jumps from a picture to a mechanism. It may coincide with one-sided flow, but the chart alone does not prove it.
Time Frame and Session Matter
A one-minute chart produces many FVGs because small bursts frequently create non-overlap. Most will be noise after costs. A daily chart produces fewer zones tied to larger information events, but entries and invalidation distances become wider. There is no ideal time frame independent of strategy.
Sessions also change meaning. Standard U.S. equity candles may exclude overnight trading. Futures charts may include nearly twenty-four hours, while crypto never closes. Traders must define session templates consistently. A zone that appears on a regular-hours chart may disappear when extended hours are included.
Macro-sensitive days deserve special caution. When yields reprice, the effect can propagate through equity duration and sector leadership rather than respect a small technical box. Our guide to why rising yields hit technology stocks explains the economic transmission that can sit behind an apparently technical move.
Common FVG Mistakes
Believing every gap must fill. Some markets never revisit a zone because new information permanently changes the price distribution.
Ignoring direction and location. A bullish FVG beneath resistance in a larger downtrend is not equivalent to one launching from long-term support.
Entering on first touch without evidence. A rectangle is an area to observe, not an automatic order.
Using the term “fair value” literally. The pattern does not estimate intrinsic value, discounted cash flow or equilibrium price.
Changing definitions across examples. Inconsistent wick, fill and expiration rules make backtests meaningless.
Overlooking costs. Low-time-frame edges can disappear after spread, commissions and slippage.
How I Would Backtest Fair Value Gaps
First, define displacement quantitatively. For example, the middle candle’s true range could exceed 1.5 times a rolling average and close in the top or bottom quarter. Then require a precise three-bar non-overlap of at least a minimum tick or ATR fraction.
Next define entry. Possible rules include first touch, midpoint, full fill or a confirmed close after rejection. Define the stop and target without looking ahead. Add a maximum age so zones do not remain active forever. Charge realistic costs and reject fills that would have been impossible at the recorded candle price.
Finally, segment the results. Compare trend versus range, high versus low volatility, open versus midday, catalyst versus ordinary sessions, and different instruments. Use an out-of-sample period. If the attractive result depends on one definition or one year, skepticism is warranted.
What an FVG Can and Cannot Tell You
An FVG can tell you that a candle sequence displayed directional speed and limited overlap. It can give traders a shared reference zone. It can support a plan for entry, invalidation and retest. It may identify a place where the auction is worth watching.
It cannot reveal who traded, prove institutional intent, guarantee unfilled orders, calculate fundamental fair value or compel a future fill. Those stronger claims require data the pattern does not contain.
The same distinction between observation and story matters in live markets. Bitcoin, for instance, can move through technical zones while dollar liquidity, yields and policy expectations shift together. Our Bitcoin macro analysis illustrates why a single chart pattern should remain subordinate to the wider causal picture.
My Bottom Line
Fair value gaps survive because they solve a real visual problem: they mark where price moved unusually fast. That is enough to make them useful. The trouble begins when the box is promoted from reference to prophecy.
I would use an FVG only when it follows meaningful displacement, sits at a preexisting level, aligns with the larger regime and produces an observable response on the return. I would define every rule before testing, size from invalidation and record failed zones. In that form, the FVG is a disciplined map of market memory. Without those constraints, it is hindsight drawn as a rectangle.
Frequently Asked Questions
Does every fair value gap get filled?
No. Many are filled partially or fully, while others remain open for years or never matter again. A fill tendency is not a timing rule or guarantee.
Is an FVG real fair value?
No. It is a technical-analysis label for a three-candle imbalance. It does not estimate a company’s intrinsic value or a security’s economically correct price.
Which boundary should I use?
Both wick-based and body-based definitions exist. Consistency matters more than choosing the definition that makes a current chart look best.
Can FVGs work without other indicators?
They can organize price action, but a stand-alone touch rule is vulnerable to noise. Trend, location, catalyst, execution and risk controls generally matter more than adding another visual label.
Primary and Technical References
- Investor.gov: Understanding Order Types
- CME Group Education: Gaps and Chart Patterns
- U.S. SEC: Market Structure Resources
Related price-action and execution guides
Fair value gaps are most useful when they are treated as one piece of market structure rather than a self-sufficient signal. Our VWAP guide adds a session-level reference for judging whether price is extended or reclaiming value. Our footprint-chart guide shows how delta and absorption can confirm or contradict what a gap appears to imply, while our market-profile guide helps place the gap inside a broader auction structure. The practical advantage is context: a gap aligned with participation, value migration and order-flow evidence is a very different setup from an isolated rectangle drawn on a chart.