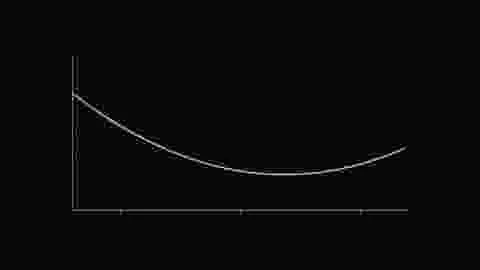
Updated August 23, 2026. Volatility skew is one of the clearest ways to see that options markets do not price every strike with the same assumptions. If implied volatility were constant across strikes, the curve would be flat. In practice, it is not. Equity puts often trade at higher implied volatility than comparable calls because investors are willing to pay more for downside protection.
The shape of that curve contains information about demand for insurance, jump risk, dealer inventory and positioning. It is not a direct forecast of the future, but it tells you where optionality is expensive and where the market is charging for asymmetry.
What is implied volatility?
Implied volatility is the volatility input that makes an option-pricing model match the market price of an option. It is inferred from the price; it is not observed directly.
If an option becomes more expensive while the underlying price, strike, time to expiry, rates and dividends remain similar, the option’s implied volatility generally rises.
What is volatility skew?
Volatility skew is the difference in implied volatility across strikes for options with the same expiration. In equity markets, lower-strike puts frequently carry higher implied volatility than at-the-money options. This is often called downside skew.
The practical interpretation is simple: crash protection is usually more expensive than equally distant upside exposure.
Why a simple Black-Scholes world would be flatter
In a simplified model with constant volatility and lognormal returns, options on the same underlying and expiration would share one volatility input. Real markets do not behave that cleanly. Volatility changes over time, returns have fat tails and large downside moves occur more frequently than a simple normal distribution suggests.
Skew is therefore partly the market’s way of correcting a model that is too elegant for reality.
Why puts are often more expensive
Institutional investors own large equity portfolios and frequently use puts to reduce drawdown risk. That creates persistent demand for downside insurance. Dealers who sell those puts must hedge gap risk, volatility exposure and balance-sheet usage.
Equity markets also have structural asymmetry. Stocks can fall 20% much faster than they usually rise 20%, and volatility often increases during declines. Downside options therefore become valuable exactly when hedging becomes most difficult.
Skew is an insurance price, not a literal probability
A common mistake is to read high put implied volatility as a pure statement that the market expects a crash. Option prices include risk premia. Investors may knowingly pay more than a statistical estimate would imply because protection has special value during stress.
Skew tells you what protection costs relative to other strikes. It does not tell you exactly what probability the market assigns to a future move.
What is a volatility smile?
A volatility smile occurs when both low-strike puts and high-strike calls have higher implied volatility than at-the-money options. The resulting curve is U-shaped. In equities, the pattern often looks more like a smirk because downside protection is structurally richer than upside options.
What is a risk reversal?
A risk reversal compares implied volatility on an out-of-the-money call and an out-of-the-money put, often using similar deltas such as 25-delta options. It provides a compact measure of whether downside or upside optionality is relatively expensive.
Different markets use different sign conventions, so the exact definition should always be checked before comparing data from different platforms.
Skew can change while the stock does nothing
Imagine a stock that remains near $100 while investors become nervous about a regulatory decision. They may buy $85 puts aggressively. Those puts can become much more expensive even if the stock price barely moves.
This is one reason options markets can reveal a change in risk perception before it appears in realized volatility.
Earnings can reshape the volatility surface
Before earnings, implied volatility usually rises in expirations that include the event because the announcement can create a gap. Strike skew can also change. Downside puts may become especially expensive if investors fear a negative surprise, while call skew can steepen around takeover or product speculation.
After the event, implied volatility often collapses because the binary uncertainty has been resolved. That is the familiar volatility crush.
Term structure and skew are different
Term structure compares implied volatility across expirations. Skew compares strikes within one expiration. Both matter. A front month may be expensive because earnings occur next week, while long-dated volatility remains normal. Within that front month, downside puts may also be unusually rich.
Dealers influence the shape
Dealers quote options based on inventory, hedging cost and risk limits. If customers repeatedly buy downside puts, dealers can become short those puts and demand more premium to warehouse the exposure.
Skew therefore reflects both investor demand and the willingness of market makers to supply options.
Why delta matters when comparing strikes
A put 10% below spot and a call 10% above spot are not necessarily symmetrical in sensitivity or probability. Traders often compare equal-delta options instead of equal percentage distances to normalize the comparison.
How to compare skew over time
- 25-delta risk reversal.
- Put IV minus at-the-money IV.
- Skew percentile versus historical observations.
- Ratio of downside IV to ATM IV.
- Changes around earnings, macro events or large spot moves.
Absolute volatility can change dramatically across regimes, so relative measures are often more useful than comparing raw put IV alone.
When steep skew can create opportunity
If downside puts are extremely expensive, a trader may prefer structures that sell some of that rich volatility rather than buying outright protection. Put spreads, collars and risk reversals can do this.
But expensive does not mean mispriced. A steep skew can be justified by genuine crash risk. Selling downside options has negative convexity: many small gains can be interrupted by a very large loss.
Put spreads and skew
A put spread buys one downside put and sells a lower-strike put. When downside skew is steep, the short lower-strike option can also be expensive, reducing the net premium of the hedge.
The trade-off is capped protection. Below the short strike, the hedge stops gaining.
Collars and skew
A collar combines long stock, a protective put and a short call. The relative richness of puts and calls determines how expensive the structure is. If puts are very expensive and calls cheap, protection may require substantial net premium.
Portfolio hedging should look beyond headline VIX
A portfolio manager buying index protection should ask not only whether at-the-money volatility is high, but also how expensive downside skew is. Deep out-of-the-money puts can remain expensive even when headline volatility looks calm.
Why skew often steepens during stress
When markets fall quickly, investors demand more protection, realized volatility rises and dealers can become less willing to warehouse downside risk. The result is often a sharp rise in downside implied volatility relative to at-the-money options.
That means protection can become most expensive when investors most want to buy it. Hedging programs designed only after panic begins frequently pay the highest insurance premium.
Common mistakes
- Treating implied volatility as a pure forecast.
- Ignoring rates and dividends.
- Comparing options with different expirations without adjusting for term structure.
- Assuming steep skew must revert quickly.
- Selling rich puts without sizing for tail risk.
- Comparing strikes rather than deltas when the exposures are not symmetrical.
A simple workflow
- Choose one expiration.
- Identify at-the-money implied volatility.
- Compare equal-delta puts and calls.
- Calculate a risk reversal or skew spread.
- Compare the result with history.
- Check whether an event falls inside the expiration.
- Understand positioning if data is available.
- Size the trade for gap risk.
My conclusion
Volatility skew is a map of asymmetry. It shows where protection is expensive, where speculation is concentrated and how supply and demand differ across strikes.
The useful question is not simply why puts have higher IV. It is whether the current skew is unusual, what risk premium it reflects and what you are accepting if you sell it.
Once you read an options chain as a surface rather than a list, the market becomes much more informative.
Primary sources
Educational content only. Options can result in substantial losses.
Skew is best understood as relative pricing
An option can have high implied volatility and still be cheap relative to another strike. Traders therefore compare skew rather than looking at one IV number in isolation. The question is not simply whether volatility is high, but where the market is charging the largest premium.
A worked risk-reversal example
Assume a 25-delta put trades at 32% implied volatility while a 25-delta call trades at 24%. The eight-volatility-point difference shows that downside protection is materially more expensive than upside exposure. That does not mean the market predicts a crash. It means investors are paying more for downside convexity.
Index skew and single-stock skew can behave differently
Equity indices often show persistent downside skew because institutions hedge portfolios with index puts. A single stock can show very different shapes around earnings, takeover speculation or a specific regulatory event.
That is why comparing one company’s skew with the S&P 500 can be misleading without context.
Dealer Greeks matter
Gamma, vega and vanna all affect how dealers hedge a volatility surface. Changes in spot, implied volatility and time can move hedging demand even when customers do not place new trades. The surface is therefore dynamic rather than a static sentiment indicator.
Related reading on The Kapital
For nearby concepts, see our IV crush explainer, gamma exposure guide and 0DTE options explainer.
FAQ
Does high put IV mean the market expects a crash?
Not necessarily. Option prices include insurance demand and risk premia in addition to expected volatility.
What is the simplest skew measure?
A common measure compares implied volatility between equal-delta puts and calls, such as a 25-delta risk reversal.
Can skew stay steep for a long time?
Yes. Structural demand for downside protection can keep equity skew elevated for extended periods.
Is selling expensive skew automatically profitable?
No. Rich downside options can be justified by genuine tail risk, and short-volatility positions can suffer very large losses.
Skew can be normalized across volatility regimes
Raw implied volatility is difficult to compare when the entire market shifts from calm to stress. Relative measures such as put IV minus at-the-money IV or a standardized risk reversal make historical comparison more useful.
Why realized volatility still matters
Implied volatility is a price. Realized volatility is what the underlying actually does. A strategy that repeatedly sells skew can look attractive until realized downside moves exceed the premium collected. Comparing implied and realized outcomes helps identify whether insurance has historically been cheap or expensive.
FAQ addition: can a volatility smile exist in equities?
Yes. Individual stocks can show elevated implied volatility on both wings, especially around binary events, although broad equity indices more often display persistent downside skew.
Skew can also reveal upside demand
Although equity markets usually focus on downside skew, upside call demand can become dominant in takeover candidates, meme stocks or strong momentum trades. In those cases, high-strike calls may become unusually expensive and the surface can flatten or invert.
FAQ addition: should skew be traded without a volatility view?
No. A relative-volatility trade can still lose money if the entire volatility surface moves sharply. Skew should be analyzed together with overall implied volatility, realized volatility and event risk.