Research basis: September 2026. Revenue growth tells you whether a company is getting bigger. Profit margins tell you whether it is earning money on those sales. ROIC asks a harder and often more useful question: how much operating profit does the business earn for every dollar of capital required to run it?
That question goes to the heart of compounding.
A company that can repeatedly invest new capital at 25% returns can create enormous value even if its current valuation looks expensive. A company earning 6% on capital while its cost of capital is 9% can destroy value even while revenue and accounting profit continue rising.
Return on invested capital, or ROIC, is therefore one of the clearest links between business quality and valuation. It helps explain why some companies deserve premium multiples and why growth can be either extraordinarily valuable or surprisingly destructive.
What is ROIC?
ROIC = Return on Invested Capital.
A common formulation is:
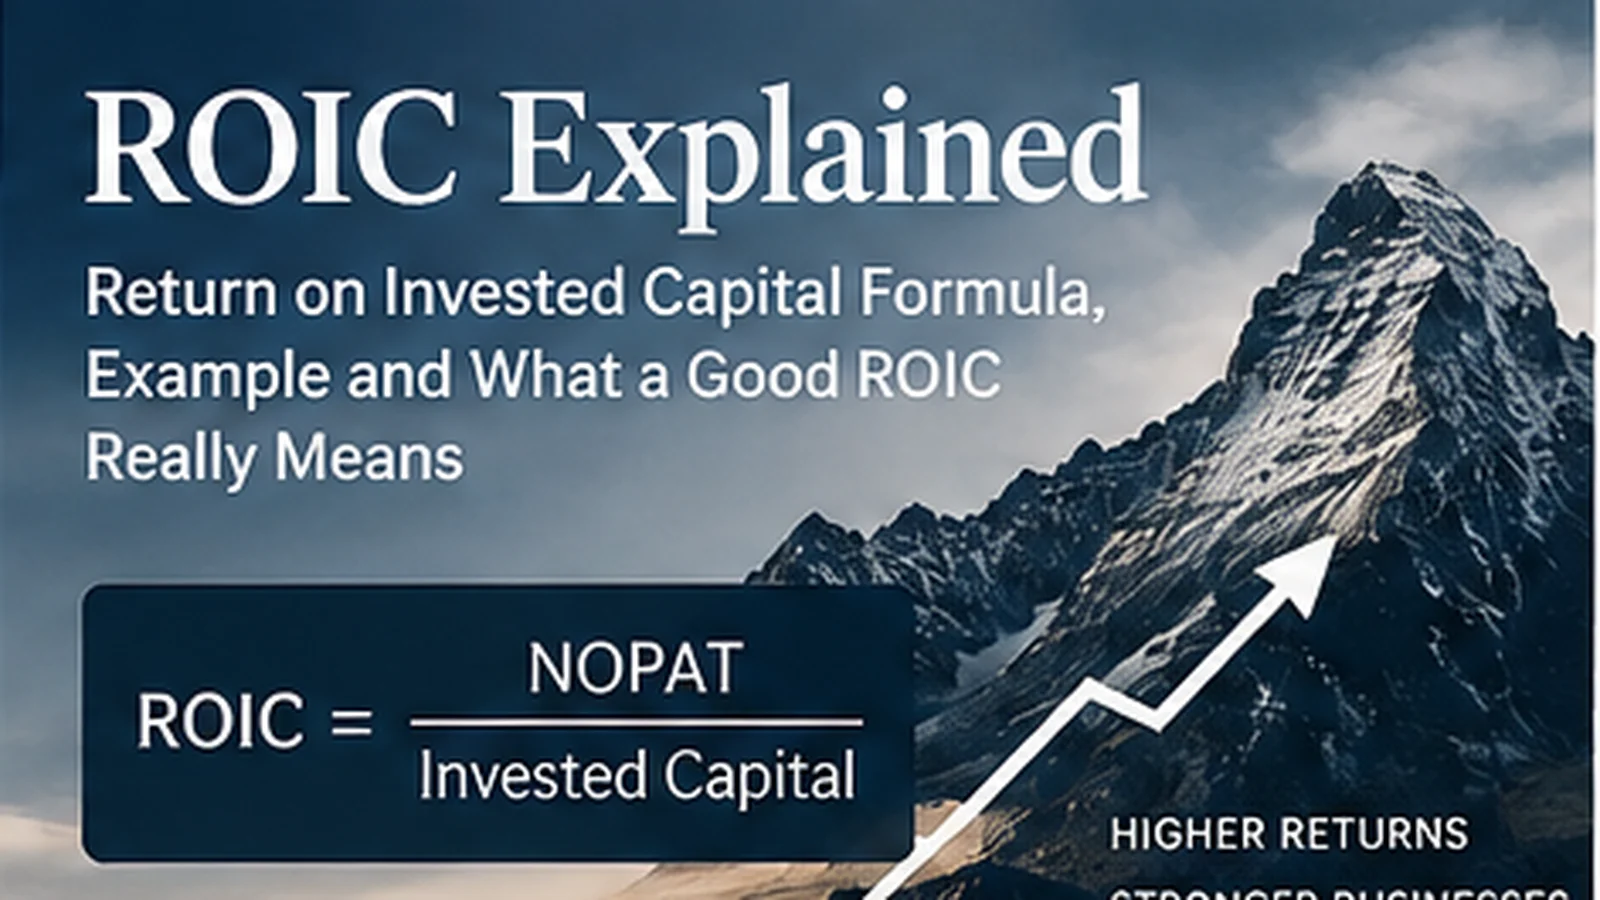
ROIC = NOPAT / Average Invested Capital.
NOPAT stands for Net Operating Profit After Tax. Invested capital represents the operating capital supplied by debt and equity investors.
The metric tries to isolate the return generated by the core operations before financing choices distort the comparison.
Illustrative example: Company A earns well above a 10% cost of capital; Company B earns below it.
Why ROIC matters more than growth alone
Growth sounds automatically positive. It is not.
Imagine a company earning a 5% return on every new dollar invested while investors require a 10% return for the risk. The company can grow rapidly by building more stores, factories or data centers, but each new investment creates less value than the capital consumed.
Now imagine another company earning 20% on incremental capital while its cost of capital is 10%. Growth becomes extremely valuable because every dollar reinvested creates economic profit.
This is why the relationship between ROIC and WACC matters more than either number alone.
Our DCF guide makes the same point from a valuation perspective: sustainable growth requires reinvestment, and the value of that growth depends on the return generated by the reinvestment.
The ROIC formula
The most common high-level formula is:
ROIC = NOPAT / Average Invested Capital.
The numerator measures after-tax operating profit. The denominator measures the capital tied up in the operations.
Using average beginning and ending invested capital is often preferable to a single year-end number because the company generated profit throughout the year while capital changed over time.
What is NOPAT?
NOPAT is net operating profit after tax.
A simplified calculation is:
NOPAT = EBIT × (1 − Operating Tax Rate).
EBIT is earnings before interest and taxes. By starting above interest expense, NOPAT removes the effect of financing structure and focuses on operating performance.
Suppose a company generates $500 million of EBIT and has a 25% normalized operating tax rate.
NOPAT = $500M × 75% = $375 million.
That $375 million is the after-tax operating profit generated by the business assets before considering how debt and equity split the result.
What is invested capital?
There are several equivalent ways to think about invested capital.
One financing-side approach is:
Invested Capital = Equity + Interest-Bearing Debt − Excess Cash.
An operating-side approach starts with operating assets and subtracts non-interest-bearing operating liabilities.
The exact calculation can differ by analyst, but the economic goal is the same: estimate the capital that must be committed to the operating business to produce NOPAT.
Why excess cash is usually removed
Cash that is not required to run the business generally does not produce the operating profit in the numerator.
If you leave a giant pile of excess cash in invested capital while NOPAT excludes investment income, ROIC will look artificially low.
This is the same matching logic that appears in enterprise value. The assets in the denominator should correspond to the operating profit in the numerator.
Our EV/EBITDA guide shows how matching errors can also distort valuation multiples.
A complete ROIC example
Assume a hypothetical company has:
- $600 million EBIT;
- 25% normalized tax rate;
- $3.0 billion average equity;
- $1.5 billion average interest-bearing debt;
- $500 million average excess cash.
NOPAT = $600M × 75% = $450M.
Invested capital = $3.0B + $1.5B − $0.5B = $4.0B.
ROIC = $450M / $4.0B = 11.25%.
If the company’s WACC is 8%, the business is earning roughly 3.25 percentage points more than its required return on capital.
If WACC were 13%, the exact same 11.25% ROIC would represent value destruction rather than value creation.
What is a good ROIC?
There is no universal threshold.
A “good” ROIC should be judged relative to the company’s cost of capital, durability and industry economics.
As a simple framework:
- ROIC below WACC: growth tends to destroy economic value.
- ROIC near WACC: growth adds scale but little economic value.
- ROIC materially above WACC: reinvestment can create value.
The spread between ROIC and WACC is sometimes called an economic spread. The wider and more durable the positive spread, the stronger the underlying economics.
Why durability matters more than one great year
A commodity producer can report enormous ROIC at the top of a price cycle. A retailer can temporarily boost returns by underinvesting in stores. A software company can show strong returns because recent R&D spending is expensed rather than capitalized.
The analytical challenge is determining whether the return is structural or temporary.
A company that sustained 20% ROIC for fifteen years through multiple cycles deserves more confidence than one that jumped from 7% to 22% for a single year.
ROIC and economic moats
Persistent high ROIC often signals some form of competitive advantage.
A business may have pricing power, low customer acquisition cost, network effects, intellectual property, brand strength, switching costs, scale economies or regulatory advantages.
Competition normally attacks high returns. If a company can earn returns far above its cost of capital for years without competitors eroding them, something is protecting the economics.
This is why ROIC is useful when studying an economic moat. The moat is the qualitative story; sustained excess returns are one quantitative consequence.
Incremental ROIC can matter more than reported ROIC
Historical ROIC tells you what the existing capital base earns. Incremental ROIC asks what the company earns on new capital.
This distinction is critical for mature businesses.
A company may report 25% ROIC because old factories or software assets were built cheaply years ago. If new investments earn only 8%, future growth will dilute the economics.
The reverse can also happen. A company may have mediocre historical ROIC but improving incremental returns because a new business model is much more attractive.
A simple incremental ROIC calculation
Suppose NOPAT rises from $400 million to $460 million while invested capital rises from $3.0 billion to $3.4 billion.
Incremental NOPAT = $60 million.
Incremental invested capital = $400 million.
Incremental ROIC = $60M / $400M = 15%.
If the company’s cost of capital is 9%, the incremental investment appears value-creating.
This type of calculation is noisy over one year, but over several years it can reveal whether growth quality is improving or deteriorating.
ROIC vs. ROE
Return on equity, or ROE, measures net income relative to shareholders’ equity.
ROE can be heavily influenced by leverage. A company can increase ROE by taking on debt and shrinking the equity base even if operating performance barely changes.
ROIC attempts to neutralize more of that financing effect by focusing on after-tax operating profit relative to the capital supplied by both debt and equity holders.
That makes ROIC especially useful for comparing operating quality across companies with different leverage.
ROIC vs. ROA
Return on assets measures profit relative to total assets.
The problem is that total assets can include excess cash, goodwill, accounting assets and operating liabilities that do not all require investor capital in the same way.
ROIC tries to isolate the capital actually committed to the operating business.
ROIC vs. gross margin
Gross margin measures product economics before operating expenses. ROIC measures how much after-tax operating profit is generated relative to capital invested.
A software company can have an 80% gross margin but weak ROIC if it spends enormous amounts on sales, R&D and acquisitions. An industrial company can have a 25% gross margin and excellent ROIC if it turns assets quickly and operates with little incremental capital.
Margins and capital efficiency are different dimensions of quality.
Why asset-light businesses often have high ROIC
Businesses that require little tangible capital can generate high ROIC because the denominator remains small relative to operating profit.
Software, marketplaces, payment networks and branded intellectual-property businesses can fit this pattern.
But accounting complicates the comparison. R&D and brand-building are often expensed immediately even though they create assets with multi-year value. That can make accounting invested capital look lower than the economic capital truly required.
Should R&D be capitalized?
For research-heavy companies, some analysts capitalize R&D by treating part of historical research spending like an investment rather than a one-period expense.
This increases invested capital and adjusts operating profit by adding back current R&D and amortizing prior research assets.
The result often lowers reported ROIC for successful technology and pharmaceutical companies, but it can create a more economically comparable measure.
There is no perfectly objective amortization period. The adjustment requires judgment.
How goodwill affects ROIC
Acquisitions create another debate.
If you include goodwill in invested capital, ROIC evaluates management’s return on the full price paid for acquisitions. That is useful for judging capital allocation.
If you exclude goodwill, ROIC focuses more narrowly on the operating returns of the underlying assets.
Both views can be informative. The key is knowing which question you are asking.
A serial acquirer that reports excellent “ROIC excluding goodwill” may still have destroyed shareholder value by repeatedly overpaying for businesses.
ROIC and buybacks
Share repurchases do not directly improve operating ROIC because they change the financing structure rather than the profitability of operating assets.
This is one reason ROIC can be more informative than EPS growth. A company can grow EPS through buybacks without improving the returns produced by the business itself.
Buybacks may still create value when shares are repurchased below intrinsic value. They are simply a capital-allocation decision rather than an operating-return improvement.
ROIC and growth: the compounding equation
A useful valuation relationship is:
Growth ≈ Reinvestment Rate × Return on Incremental Capital.
If a company can reinvest 50% of operating profit at a 20% incremental return, it can theoretically support around 10% growth.
If the same company earns only 8% on incremental capital, reinvesting 50% supports closer to 4% growth.
This relationship shows why high ROIC can make growth cheaper to fund.
Why high ROIC companies can deserve higher valuation multiples
A company that can reinvest at high returns creates more future cash flow from each dollar retained.
That can justify a premium P/E or EV/EBITDA multiple because the earnings are not merely large today; they have a productive reinvestment path.
Our P/E Ratio Explained guide shows why a higher multiple can be rational when growth quality and returns on capital are superior.
When high ROIC can be misleading
Very high ROIC is not always proof of a wonderful business.
The denominator can be unusually small because assets are fully depreciated, R&D is expensed, leases are treated differently or capital was written down in the past.
A distressed company can even report temporarily high ROIC after a large impairment shrinks invested capital.
Always understand why the denominator is small before celebrating the ratio.
ROIC for banks and insurers
ROIC is less useful for financial institutions because debt and capital are part of the operating product.
For banks, return on equity, return on tangible equity, capital ratios, net interest margins and credit losses are usually more natural measures.
No metric should be forced onto a business model it was not designed to describe.
ROIC through a cycle
Cyclical businesses should be evaluated across a full cycle rather than one peak year.
A semiconductor manufacturer or commodity producer can earn extraordinary returns during shortages and weak returns when supply catches up.
Normalized ROIC should reflect the return on capital through both favorable and unfavorable conditions.
Seven common ROIC mistakes
- Using year-end invested capital instead of an average when capital changed substantially.
- Leaving excess cash in the denominator while excluding cash income from NOPAT.
- Comparing companies with radically different R&D accounting without adjustment.
- Ignoring acquisition goodwill when judging management’s capital allocation.
- Treating peak-cycle ROIC as sustainable.
- Comparing ROIC with no reference to the cost of capital.
- Focusing on historical ROIC while incremental returns are deteriorating.
A practical ROIC checklist
- Calculate normalized EBIT.
- Apply a normalized operating tax rate.
- Estimate average invested capital.
- Remove genuinely excess cash.
- Review goodwill, leases and R&D treatment.
- Compare ROIC with WACC.
- Examine at least five years when possible.
- Estimate incremental ROIC on new investment.
- Ask what competitive advantage protects the return.
- Check whether future growth can still be funded at similar returns.
ROIC and intrinsic value
ROIC matters to valuation because growth only creates value when new investment earns more than the required return.
A DCF can produce the same near-term cash flows for two companies but very different terminal values if one has a long runway to reinvest at high returns and the other does not.
This is why business quality and valuation cannot be separated cleanly. The quality of reinvestment determines the value of future growth.
Bottom line
ROIC is powerful because it forces growth and profitability into the same frame.
Revenue can grow while value is destroyed. Margins can look attractive while the business consumes enormous capital. EPS can rise because of buybacks. ROE can rise because of leverage.
ROIC asks a more fundamental question: what return is the operating business generating on the capital it actually needs?
The most important comparison is not ROIC versus an arbitrary 10% benchmark. It is ROIC versus the company’s cost of capital and versus the returns available on incremental investment.
A business that can sustain a wide positive spread between ROIC and WACC while reinvesting a large share of earnings has one of the most valuable economic structures in public markets.
A business growing below its cost of capital may become larger every year while becoming less valuable per dollar invested.
That is why ROIC belongs near the center of fundamental analysis, not at the edge of a ratio screen.
ROIC FAQ
What does ROIC stand for?
ROIC stands for return on invested capital. It measures after-tax operating profit relative to the capital committed to the operating business.
What is the ROIC formula?
A common formula is NOPAT divided by average invested capital.
What is a good ROIC?
A good ROIC is generally one that is sustainably above the company’s cost of capital. The larger and more durable the positive spread, the stronger the economics.
Is ROIC better than ROE?
They answer different questions. ROE focuses on common equity and can be heavily influenced by leverage. ROIC focuses more on operating returns across debt and equity capital.
Why can ROIC be extremely high?
High ROIC can reflect a genuinely asset-light, high-quality business, but it can also result from accounting effects such as expensed R&D, old depreciated assets or write-downs that shrink invested capital.
Should goodwill be included in ROIC?
Including goodwill is useful when judging management’s total acquisition returns. Excluding it can be useful when studying the underlying operating assets. Analysts should be explicit about the purpose.
Sources
- CFA Institute — Equity valuation and corporate-finance curriculum materials on capital allocation and cost of capital.
- NYU Stern / Aswath Damodaran — Return on invested capital, cost-of-capital and industry data.
- U.S. Securities and Exchange Commission — Financial statement guidance.
This article is educational analysis and does not constitute individualized investment advice.