Research basis: September 2026. Gross margin is one of the simplest numbers on an income statement and one of the most revealing. It sits near the top of the profit-and-loss statement, before marketing budgets, research spending, management salaries and interest expense can blur the operating picture.
At its core, gross margin asks a basic question: after paying the direct costs required to deliver the product or service, how much of each revenue dollar is left?
That leftover pool funds everything else. It pays for engineers, sales teams, headquarters, interest, taxes and eventually shareholders. A business with a 90% gross margin has enormous room to absorb operating expenses. A business with a 10% gross margin has very little.
But gross margin is not a universal quality score. Different industries classify costs differently. A supermarket can be excellent with a low margin. A software company can be weak despite an 80% gross margin if it spends almost all of the remainder acquiring customers.
This guide explains the gross-margin formula, why the metric matters, how pricing power and scale can change it, and how investors should use it without making cross-industry comparisons that do not make economic sense.
What is gross margin?
The basic formula is:
Gross Margin = (Revenue − Cost of Goods Sold) ÷ Revenue.
Cost of goods sold may also be called cost of revenue, cost of sales or a similar term depending on the company and industry.
Suppose a company generates $1 billion of revenue and incurs $600 million of direct costs.
Gross profit is $400 million.
Gross margin is:
$400M ÷ $1.0B = 40%.
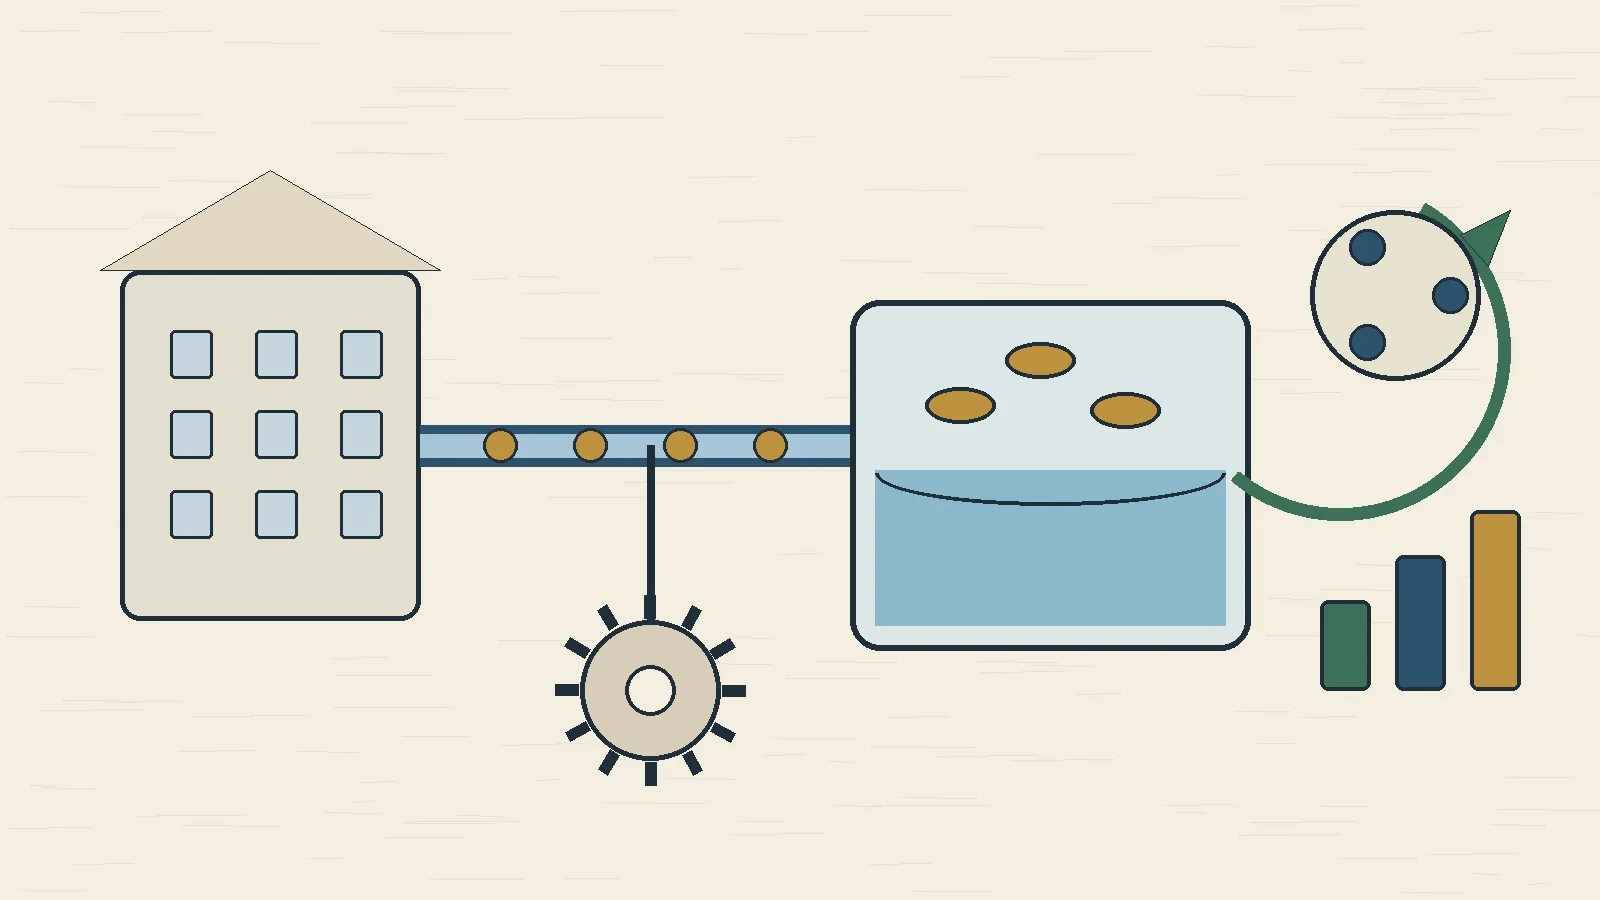
The customer pays one dollar.
Materials, hosting, labor or inventory directly tied to delivery.
40% gross margin
Gross profit versus gross margin
Gross profit is an absolute dollar amount. Gross margin expresses gross profit as a percentage of revenue.
A company can grow gross profit while gross margin declines. For example, revenue can rise from $1 billion to $2 billion while margin falls from 50% to 40%. Gross profit still rises from $500 million to $800 million.
This distinction matters because margin describes the economics of each revenue dollar, while gross profit tells you the total pool available to fund operating expenses.
Why gross margin matters
Gross margin provides clues about:
- pricing power;
- input-cost pressure;
- product mix;
- competitive intensity;
- economies of scale;
- business-model quality;
- potential future operating leverage.
It is often the first place investors can see whether a company is selling more profitably or merely selling more.
High gross margin does not automatically mean a great business
A software company can report an 85% gross margin and still lose money if sales commissions, R&D and administration consume more than the remaining 85 cents of each revenue dollar.
A distributor can operate at 15% gross margin and produce excellent returns on capital if inventory turns quickly and operating expenses are tightly controlled.
This is why gross margin should be connected to operating margin, free cash flow and ROIC.
Different industries naturally have different margins
Industry structure determines what a normal gross margin looks like.
Software and digital products can have very high gross margins because the marginal cost of delivering another copy or user can be low.
Retailers often have much lower gross margins because they purchase physical goods that represent a large portion of selling price.
Industrial manufacturers sit somewhere in between and may carry significant direct material and labor costs.
This makes cross-industry comparisons dangerous. A 30% gross margin can be exceptional in one sector and disastrous in another.
What belongs in cost of goods sold?
The precise contents of COGS vary by business.
For a manufacturer, direct costs may include raw materials, factory labor and production overhead.
For a retailer, the primary cost is usually merchandise purchased for resale.
For software-as-a-service companies, cost of revenue can include cloud hosting, customer support, payment processing and certain personnel costs.
For a marketplace, the classification can depend heavily on whether the company reports revenue gross or net.
This is why investors should read the accounting policy notes rather than assuming every company defines cost of revenue identically.
Pricing power and gross margin
Pricing power means a company can raise prices without losing enough volume to offset the increase.
If selling prices rise while direct unit costs remain stable, gross margin expands.
Suppose a product sells for $100 and costs $60 to produce. Gross margin is 40%.
If the company raises price to $110 while cost remains $60, gross profit becomes $50 and gross margin rises to roughly 45.5%.
A 10% price increase created a much larger percentage increase in gross profit per unit.
Why inflation can squeeze gross margin
The reverse occurs when input costs rise faster than selling prices.
If the $100 product still sells for $100 but production cost rises from $60 to $70, gross margin falls from 40% to 30%.
This is one of the fastest ways inflation shows up in corporate earnings.
Companies with strong pricing power may pass costs through. Companies facing intense competition may be forced to absorb them.
Product mix can change gross margin without any pricing change
A company selling multiple products can experience margin changes simply because customers buy more of one category and less of another.
Suppose high-margin software subscriptions represent 60% of revenue one year and 45% the next because a lower-margin hardware product grows rapidly.
Total revenue can accelerate while consolidated gross margin falls.
That does not necessarily mean pricing deteriorated. It may reflect a mix shift.
Scale can expand gross margin
Some direct costs contain fixed or semi-fixed elements. Cloud infrastructure, factories and fulfillment networks can become more efficient as volume rises.
If revenue grows faster than these direct costs, gross margin can expand.
This is especially important in young companies. A business with a 55% gross margin today may reach 70% at scale if unit economics improve and fixed delivery infrastructure is utilized more efficiently.
But scale does not guarantee margin expansion
Some businesses face the opposite problem. Growth can require entering lower-margin customer segments, discounting prices or building more expensive infrastructure.
As a result, larger scale can coincide with lower gross margins.
Investors should identify the specific mechanism expected to produce operating leverage rather than assuming size automatically creates efficiency.
Gross margin versus operating margin
Gross margin stops after direct production or service-delivery costs. Operating margin also subtracts operating expenses such as research, sales, marketing and administration.
A company can have:
- 80% gross margin;
- 40% sales and marketing expense;
- 25% R&D expense;
- 20% G&A expense.
That cost structure would produce an operating loss despite the impressive gross margin.
This is why gross margin tells you about product economics, while operating margin tells you more about the full operating model.
Gross margin and P/S valuation
Gross margin is one of the most important inputs when interpreting a price-to-sales ratio.
A company at 6× sales with an 85% gross margin may have enormous future profit potential. Another at 2× sales with a 15% gross margin may have far less room for earnings.
Our Price-to-Sales Ratio Explained guide shows why a sales multiple is meaningless without margin context.
Gross-margin dollars can matter more than the percentage
Investors sometimes become obsessed with margin percentages and ignore absolute gross-profit growth.
Suppose revenue doubles from $1 billion to $2 billion while gross margin declines from 70% to 65%.
Gross profit rises from $700 million to $1.3 billion.
The margin decline deserves explanation, but the company still created $600 million of additional gross profit to fund operating expenses and future growth.
For growing companies, both percentage margin and gross-profit dollars matter.
A worked comparison
Consider two hypothetical companies, both with $2 billion of revenue.
Company A: 75% gross margin. Gross profit = $1.5 billion.
Company B: 30% gross margin. Gross profit = $600 million.
If both spend $700 million on operating expenses, Company A produces $800 million of operating profit while Company B loses $100 million.
The revenue base is identical. The economics are not.
Revenue: $2.0B
Gross margin: 75%
Gross profit: $1.5B
Revenue: $2.0B
Gross margin: 30%
Gross profit: $600M
What does gross-margin expansion tell investors?
Consistent expansion can indicate:
- successful price increases;
- better product mix;
- lower input costs;
- scale efficiencies;
- improved manufacturing yield;
- declining cloud or fulfillment cost per unit.
But the source matters. Margin expansion caused by temporary commodity-price relief is different from structural improvement driven by a better product mix.
What does gross-margin contraction tell investors?
Declining margins can signal:
- discounting;
- competition;
- higher material or labor cost;
- an unfavorable product mix;
- lower factory utilization;
- rising hosting or fulfillment expense;
- accounting reclassification.
The trend deserves investigation, but one quarter should not automatically be treated as permanent.
Seasonality can distort gross margin
Retailers, travel companies and consumer businesses can experience seasonal shifts in product mix and discounting.
Comparing the fourth quarter with the third quarter may therefore be less useful than comparing the fourth quarter with the same quarter one year earlier.
For seasonal businesses, year-over-year comparisons and full-year margins often provide cleaner evidence.
Acquisitions can change reported gross margin
If a company acquires a lower-margin business, consolidated gross margin can fall even when the original business remains healthy.
The opposite can happen when a high-margin business is acquired.
Investors should separate organic margin changes from changes caused by consolidation.
Revenue recognition can alter the denominator
Some companies report transactions on a gross basis, recognizing the full customer payment as revenue. Others report only the net commission or fee they retain.
This can make gross-margin comparisons especially difficult for marketplaces, travel platforms and payment businesses.
The accounting policy determines whether certain pass-through costs appear in revenue and cost of revenue or are excluded from both.
Gross margin and stock-based compensation
Some companies allocate stock-based compensation to cost of revenue, which reduces reported gross margin. Others may have a larger portion classified in operating expenses.
When comparing peers, investors should understand whether compensation classification differs materially.
Our Share Dilution Explained guide shows why stock compensation matters even when it is non-cash.
Gross margin and free cash flow
A high gross margin does not guarantee high free cash flow.
A company may require enormous sales spending, R&D or capital expenditure. Working capital can also absorb cash.
Our Free Cash Flow Yield guide provides the next analytical layer: how much of the accounting economics eventually becomes cash available to capital providers.
Why margin stability matters
Stable gross margins across recessions, inflation shocks and competitive cycles can be evidence of pricing power or structural cost advantages.
A business whose margin swings from 60% to 30% every cycle deserves a different valuation from one that stays between 68% and 72%.
Predictability reduces the uncertainty around future profit potential.
Gross margin in software
Software companies often report high gross margins because the direct cost of serving another user can be low.
But infrastructure-heavy software can have lower margins due to cloud-compute expenses, third-party data or implementation labor.
Investors should not assume every software business should eventually reach the same margin.
Gross margin in semiconductors
Semiconductor gross margins can be highly sensitive to product mix, capacity utilization, manufacturing model and industry cycle.
Fabless chip designers can look structurally different from integrated manufacturers that own fabrication plants.
Peak-cycle margins should not automatically be extrapolated into perpetuity.
Gross margin in retail
Retail margins are usually much lower, but inventory turnover and operating efficiency can compensate.
A retailer earning a 25% gross margin and turning inventory quickly may generate excellent returns on capital. The percentage alone does not determine quality.
Gross margin in airlines and commodity businesses
In businesses where direct input prices move rapidly, gross margin can be volatile. Fuel, raw materials and spot pricing can dominate short-term results.
Normalized margins across a cycle are usually more useful than one strong year.
A practical gross-margin checklist
- Calculate gross margin for at least five years.
- Compare with close industry peers.
- Read what the company includes in cost of revenue.
- Separate pricing from input-cost effects.
- Check product-mix changes.
- Look for seasonality.
- Identify acquisition effects.
- Compare gross-profit growth with revenue growth.
- Connect gross margin to operating margin.
- Check whether higher margins actually convert to free cash flow and ROIC.
Gross margin FAQ
What is a good gross margin?
There is no universal good gross margin. The right benchmark depends on the industry, business model and cost classification.
Is higher gross margin always better?
Not necessarily. A lower-margin business can still generate excellent returns through high asset turnover and disciplined operating costs.
What causes gross margin to rise?
Common drivers include price increases, lower input costs, better product mix, scale efficiencies and improved utilization.
What causes gross margin to fall?
Discounting, higher direct costs, weaker product mix, competition, underutilized capacity and accounting changes can all reduce gross margin.
Is gross margin the same as operating margin?
No. Gross margin subtracts direct costs. Operating margin also subtracts operating expenses such as R&D, sales and administration.
Bottom line
Gross margin is valuable because it reveals the economics of a revenue dollar before many other expenses enter the picture.
It can expose pricing power, input-cost pressure, mix shifts and scale efficiencies. It also helps explain why two companies with identical revenue can deserve completely different valuations.
But the number only makes sense in context. Industry structure matters. Accounting classifications matter. High gross margin does not guarantee high free cash flow or strong returns on capital.
The most useful question is therefore not “Is 70% a good gross margin?” It is: why is the margin at this level, how durable is it, and what does the company do with the gross profit that remains?
Primary and authoritative sources
- U.S. SEC — Beginners’ Guide to Financial Statements
- CFA Institute — Analyzing Income Statements
- NYU Stern / Aswath Damodaran — Industry margin and valuation data
This article is educational analysis and does not constitute individualized investment advice.