Research basis: September 2026. Share dilution is one of the easiest ways to misunderstand a growing company. Revenue can rise. Net income can rise. Market capitalization can rise. Management can even announce a major buyback. And yet the economic claim represented by each existing share can improve far less than the headline numbers suggest.
The reason is simple: shareholders do not own “the company” in the abstract. They own a fraction of the company represented by a specific number of shares. If the denominator changes, the ownership economics change with it.
This is why dilution deserves to be analyzed with the same seriousness as margins, debt or valuation. A company that grows operating profit 20% while increasing its diluted share count 25% has not delivered 20% growth to each existing share. A company that grows only 5% while reducing its share count 5% may produce better per-share economics than the headline growth rate suggests.
This guide explains how dilution works, why companies issue new shares, when dilution can create value, when it destroys value, and how to build a practical fully diluted share count before you decide whether a stock is actually cheap.
What is share dilution?
Share dilution occurs when the number of shares or potential shares representing ownership in a company increases.
Imagine a company with 100 shares outstanding. You own 10. Your ownership percentage is:
10 ÷ 100 = 10%.
Now the company issues another 100 shares to new investors. There are 200 shares outstanding. You still own the same 10 shares, but your percentage ownership becomes:
10 ÷ 200 = 5%.
Nothing was removed from your brokerage account. The position still shows 10 shares. But each share now represents a smaller fraction of the business.
100 shares outstanding
You own 10 shares
Your ownership: 10%
200 shares outstanding
You still own 10 shares
Your ownership: 5%
Dilution is not automatically value destruction
If a company issues shares, existing owners surrender part of their percentage ownership. But the company also receives something in return. It may receive cash, another business, productive assets, employee services or the cancellation of debt.
The correct question is therefore not simply whether the share count increased. It is whether the value received by the company exceeded the value transferred away through the new shares.
A company can dilute ownership percentages while still increasing value per share. It can also issue stock in a way that makes every existing share worth less.
A simple example of neutral dilution
Assume a company is worth $1 billion and has 100 million shares outstanding. The implied value per share is $10.
The company issues 10 million new shares at $10 each and raises $100 million.
- Old company value: $1.0 billion.
- New cash raised: $100 million.
- New total value: approximately $1.1 billion.
- New share count: 110 million.
Value per share remains approximately $10. The original shareholders own a smaller percentage of a larger asset base. Their percentage ownership fell, but the transaction did not necessarily destroy economic value.
Now change only the issue price
Suppose the same company issues those 10 million shares at $5 rather than $10. It raises only $50 million.
The theoretical value becomes $1.05 billion. Divided by 110 million shares, that is roughly $9.55 per share.
Existing shareholders have transferred value because the company sold ownership below the assumed value of the business. This is why the price at which equity is issued matters. Dilution is an exchange rate.
Why per-share economics matter more than company-level growth
Imagine net income rises from $100 million to $120 million. That is 20% growth. But diluted shares rise from 100 million to 130 million.
Year-one EPS is $1.00. Year-two EPS is only about $0.92. The company became more profitable in aggregate while earnings per share declined.
Result: EPS falls from $1.00 to about $0.92 even though total profit rises 20%.
This is why our EPS Explained guide focuses on both the numerator and denominator.
Where dilution comes from
- secondary equity offerings;
- employee stock options;
- restricted stock units and performance shares;
- convertible debt;
- warrants;
- stock-financed acquisitions;
- at-the-market equity programs;
- preferred securities that can convert into common stock.
Some of these instruments create actual shares immediately. Others create potential shares that become relevant only after vesting, exercise or conversion conditions are met.
Basic shares versus diluted shares
Basic EPS uses the weighted-average number of common shares outstanding during the period. Diluted EPS attempts to reflect additional potential shares when accounting rules treat them as dilutive.
SEC filings routinely reconcile the basic share count with potential dilution from restricted stock, options and other equity awards. Diluted EPS is therefore a better starting point than basic EPS for many valuation exercises.
But there is an important limitation: accounting diluted shares are not always the same thing as the maximum economic share count an investor should model.
Why reported diluted EPS can still understate future dilution
Potential securities can be excluded from diluted EPS if they are anti-dilutive under the current accounting calculation. A company reporting losses can have millions of options or convertible shares outstanding that do not appear in diluted EPS because including them would make loss per share look smaller.
Those securities have not disappeared. If the company later becomes profitable, the stock price rises or vesting conditions are satisfied, some of those claims can become relevant.
A serious dilution analysis therefore goes beyond the income statement and reads the EPS footnote, stock-compensation note, convertible-debt disclosures, warrant disclosures, financing agreements and the statement of shareholders’ equity.
Stock-based compensation: dilution without a financing headline
Employee equity compensation is one of the most common sources of gradual dilution, especially in technology and growth companies.
Restricted stock units, options and performance awards can be economically sensible. Equity compensation can align employees with shareholders, conserve cash and help recruit talent.
But it is not free. When shares vest or options are exercised, existing shareholders can own a smaller percentage of the business. The expense may be non-cash in the current period. The ownership transfer is still economic.
The free-cash-flow trap created by stock compensation
Stock-based compensation is added back in the operating cash-flow statement because it is a non-cash expense in the period. That can make reported free cash flow look very strong.
Suppose a company reports $1.0 billion operating cash flow, $200 million capital expenditure, $800 million free cash flow and $350 million stock-based compensation.
The $800 million FCF is a real cash-flow figure under the chosen definition. But if employees are simultaneously receiving hundreds of millions of dollars of equity value, the economic benefit flowing to existing owners is more complicated.
This does not mean investors should automatically subtract every dollar of stock compensation from FCF. It means FCF should be analyzed together with the diluted share-count trend and buyback spending.
Our Free Cash Flow Yield guide makes the same point from the valuation side.
Buybacks can hide rather than reverse dilution
A company announces a $2 billion repurchase program. Headlines say it is returning capital to shareholders. But suppose the company issues $1.8 billion of equity compensation over the same period.
The gross buyback sounds enormous. The net reduction in shares may be tiny.
Cash spent repurchasing shares.
Employee awards offset much of the repurchase.
The share count may barely decline.
Secondary offerings: when dilution funds survival or growth
A secondary offering is one of the clearest forms of dilution. The company sells additional shares to raise capital.
For a profitable company with attractive reinvestment opportunities, an equity raise can fund high-return expansion. For a loss-making business, the same mechanism may simply extend the cash runway.
Consider a biotech company with $150 million of cash and $100 million of annual cash burn. If its lead drug is still two years away from a decisive trial result, management may need to raise capital well before reaching profitability. Existing owners are diluted, but without financing the company could run out of cash before the asset has a chance to create value.
The lower the stock price, the more shares may be required
Imagine a company needs to raise $100 million. At a $10 share price, it must issue roughly 10 million shares. At $2, it must issue 50 million shares. At $0.50, it must issue 200 million shares.
10M
new shares
50M
new shares
200M
new shares
This is why persistent cash burn can create a reflexive financing problem. A falling share price makes future equity raises more dilutive. Greater dilution can weaken investor confidence. Weak confidence can pressure the share price further.
At-the-market programs: dilution by drip rather than headline
An ATM program allows a company to sell shares into the market over time rather than completing one large underwritten offering. The flexibility can be valuable, but it can also make dilution less visible because the share count increases gradually across quarters.
Convertible debt: debt today, potential shares tomorrow
Convertible notes sit between debt and equity. They may begin as a fixed-income claim but convert into shares if contractual conditions are met.
The potential dilution depends on the principal amount, conversion price, settlement method and anti-dilution provisions.
Our Convertible Debt Explained guide goes deeper into fixed conversion prices, floating conversion structures and capped calls.
Warrants: hidden optionality in the cap table
Warrants give holders the right to acquire shares under specified terms. They are common in small-cap financings, SPAC structures and distressed capital raises.
If a company has 100 million common shares but also 30 million economically relevant warrants, the 100 million headline share count may understate the ownership base that matters in a successful scenario.
Warrants can also bring cash into the company when exercised, so the analysis should not treat them as pure dilution without considering the exercise proceeds.
Acquisition dilution: paying with stock
Companies frequently use their own shares as acquisition currency. This can be intelligent when the buyer’s stock is richly valued and the acquired assets are attractive. It can be destructive when management overpays.
Suppose a company issues stock worth $2 billion to acquire a business worth only $1.4 billion on realistic cash-flow assumptions. The buyer becomes larger and revenue may surge, but existing shareholders still surrendered $2 billion of equity value for something worth less.
Why “accretive EPS” can still hide a bad deal
A high-P/E company can acquire a lower-P/E company with stock and manufacture near-term EPS accretion even if the strategic return on capital is mediocre.
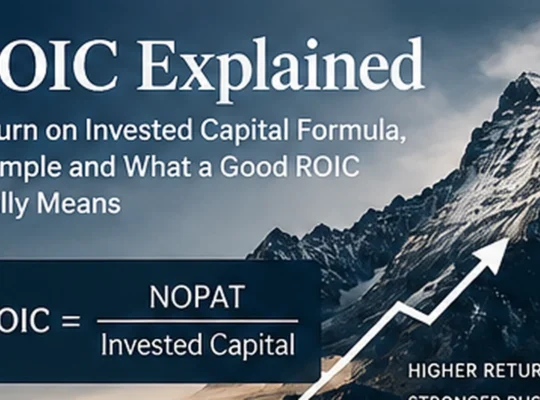
This is one reason ROIC matters. The long-term question is whether the capital committed to the acquisition earns an attractive return.
Reverse stock splits do not erase dilution history
A reverse split changes the unit count, not the ownership economics. If you own 100 shares at $1 and the company executes a 1-for-10 reverse split, you may end with 10 shares at approximately $10. The position value is roughly unchanged before market movement.
If the company previously issued hundreds of millions of shares to fund losses, a reverse split does not reverse that transfer of ownership. It simply compresses the share count into larger units.
Market capitalization can rise while your stock price goes nowhere
Market capitalization equals Share Price × Shares Outstanding.
Suppose a stock remains at $10 while shares outstanding rise from 100 million to 150 million. Market cap increases from $1.0 billion to $1.5 billion even though the share price is unchanged.
A flat stock-price chart can therefore hide a substantial increase in the value the market assigns to the company if the share count rose materially.
Dilution and intrinsic value per share
If a DCF estimates that equity is worth $10 billion, that number is incomplete until you decide what share count should divide it.
Using 100 million basic shares implies $100 per share. Using 120 million fully diluted shares implies approximately $83.33.
The business value did not change. The ownership denominator did. This is why dilution belongs inside valuation rather than as a footnote added after the target price is calculated.
How I build a practical fully diluted share count
- Start with current common shares outstanding.
- Check weighted-average diluted shares used in EPS.
- Add RSUs and performance awards likely to vest where not already captured.
- Review in-the-money employee options.
- Review warrants and their exercise prices.
- Model convertible debt under relevant stock-price scenarios.
- Review preferred securities that can convert.
- Check pending acquisition consideration payable in stock.
- Review ATM capacity and recent issuance if ongoing financing is likely.
- Run a base case and a stress case.
The goal is not to create a theoretical maximum where every impossible security converts simultaneously. The goal is to estimate the economically plausible ownership base under the scenario you are valuing.
The share-count growth rate is an underrated metric
Suppose diluted shares move from 100 million to 105 million, then 113 million, 122 million and 132 million over five years. The share count increased 32%.
Revenue might have grown 50% during the same period. That sounds impressive. But revenue per diluted share grew far less.
This is why per-share versions of major metrics can be useful: revenue per share, free cash flow per share, book value per share and earnings per share.
Good dilution: what it looks like
Dilution can create value when the company sells equity at an attractive price and invests the proceeds at high returns.
- Issuing highly valued shares to buy a business at a lower valuation.
- Raising equity to fund a project with returns far above the cost of capital.
- Issuing shares to repair a balance sheet and remove severe financial distress.
- Using employee equity to attract exceptional talent when the compensation structure creates more value than it transfers.
In these cases, existing shareholders own a smaller percentage of something potentially much more valuable.
Bad dilution: the pattern investors should fear
- The company burns cash.
- It issues shares.
- The cash extends runway but does not improve unit economics.
- The share price falls.
- The company needs more cash.
- It must issue even more shares at a lower price.
This can continue for years. Revenue may grow during the process, but current shareholders repeatedly surrender ownership to fund the growth.
For these companies, the central valuation variable may not be the current share price. It may be the future share count required before the business becomes self-funding.
A practical dilution checklist
- Share-count trend: Are diluted shares rising or falling over three to five years?
- Cash burn: Will the company likely need additional financing?
- Stock compensation: How large is SBC relative to revenue, FCF and buybacks?
- Buybacks: Are they genuinely reducing shares or merely offsetting issuance?
- Convertibles: How many shares could be created under realistic scenarios?
- Warrants: What is the potential additional share count and what cash would exercise bring in?
- Acquisitions: Is stock being issued for assets worth more than the ownership surrendered?
- Issue price: Is equity being sold at a reasonable valuation or during distress?
- Per-share growth: Are EPS and FCF per share keeping up with company-level growth?
- Runway: How many future equity raises may be required before the business is self-funding?
Share dilution FAQ
Is share dilution always bad?
No. Dilution is an exchange. If the company receives assets or capital worth more than the value of the shares issued, existing shareholders can still benefit even though their percentage ownership falls.
How do I calculate dilution?
A simple ownership calculation compares your shares with total shares before and after issuance. For valuation, investors should also estimate a fully diluted share count that includes economically relevant options, RSUs, warrants and convertibles.
Does stock-based compensation dilute shareholders?
It can. Equity awards can create new shares as they vest or are exercised. Even if a company uses buybacks to offset the issuance, the cash spent on those buybacks is part of the economic cost.
Do buybacks cancel dilution?
Only if repurchases exceed issuance sufficiently to reduce the net share count. A large buyback program can coexist with a flat or rising share count if employee issuance is also large.
Does a reverse stock split fix dilution?
No. A reverse split changes the number of units and the price per unit. It does not undo the ownership transferred through previous equity issuance.
Bottom line
Share dilution is easy to ignore because it rarely feels dramatic in the moment. Your account still shows the same number of shares. The company may be growing. Management may describe equity compensation as non-cash and new financing as strategic.
But ownership is arithmetic.
If the denominator grows, each existing share represents a smaller fraction of the company unless the value created by the new capital more than compensates for that change.
Track the diluted share count. Read the equity and compensation notes. Model convertibles and warrants. Compare buybacks with issuance. Most importantly, measure growth on a per-share basis.
The decisive question is not whether the company diluted shareholders. It is: what did each existing share receive in exchange?
Primary and authoritative sources
- U.S. SEC — Beginners’ Guide to Financial Statements
- U.S. SEC filing example — basic and diluted EPS disclosure
This article is educational analysis and does not constitute individualized investment advice.